


An alternative approach: Log-stable distributions
In the early 1960s, Benoit Mandelbrot, a mathematician teaching economics at the University of Chicago, was advising a doctoral student named Eugene Fama. Mandelbrot had developed a statis
tical model for percentage changes in the price of cotton that had "fat tails." That is, the model assigned nontrivial probabilities to large percentage changes. In his doctoral dissertation, Fama applied Mandelbrot's model to stock prices and obtained promising results.5 Until recently, however, the work of Mandelbrot and Fama had been largely ignored.6
In his dissertation, Fama assumed that the logarithm of stock returns followed a fat-tailed distribution called a "stable Paretian distribution," or stable distribution.7 Hence, we refer to the resulting distribution of returns as a "log-stable distribution."
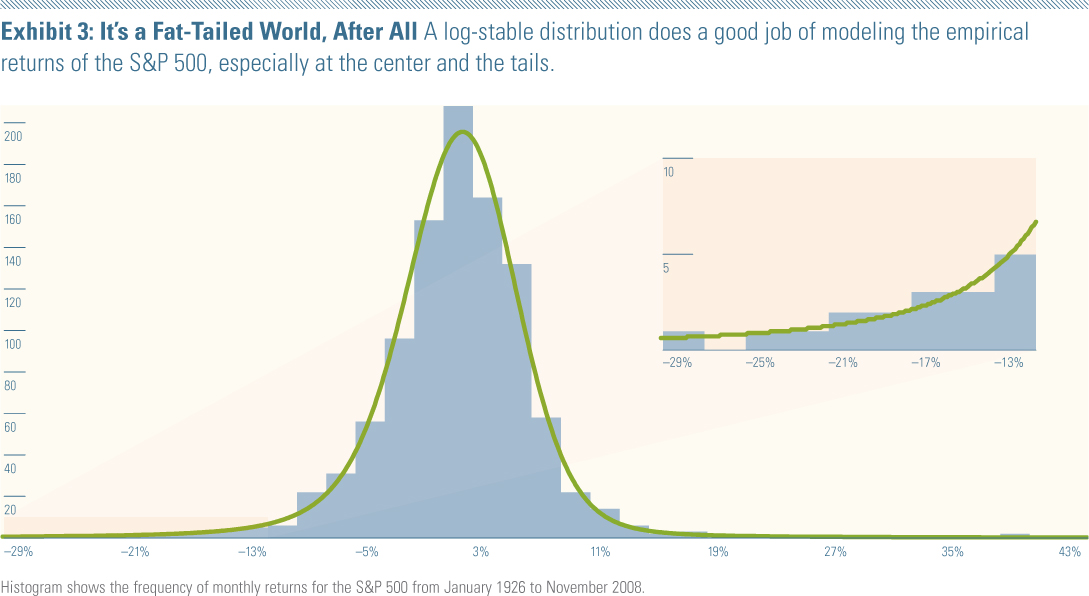
We can illustrate an example of Fama's work by using the same S&P 500 histogram in our earlier exhibit but with a log-stable distribution curve overlaying it instead of a lognormal curve.8 The log-stable model (Exhibit 3) fits the empirical distribution much closer than the lognormal both at the center and the tails. In particular, note the close match between the density curve and the histogram between negative 13% and negative 29%.
The tails of a stable distribution are so fat that its variance is infinite. In other words, the concepts of standard deviation and variance are not defined for stable distributions. You might find the idea of an infinite variance counterintuitive, because it is possible to calculate a standard deviation for any finite set of data. However, the underlying mathematical distributions that we use to model asset returns assign probabilities over the range from negative infinity to positive infinity.9 Some distributions that cover this infinite range assign so little probability out in the tails that variance can be defined. These are "thin-tailed" distributions, the normal or bell-shaped distribution being the best-known example. Other distributions assign so much probability to the tails that variance is infinite. Such is the case with stable distributions.
The manner in which a stable distribution assigns probability to its tails is very close to what is known as "power law." When a distribution of a loss follows a power law, a plot of logarithm of the magnitude of loss (x) versus the logarithm of the probability of the loss turning out to be x or worse is a downward- sloping straight line. Therefore, while the probability of loss decreases with the magnitude of loss, it does so gradually.
In Exhibit 4, we plot the magnitude of loss versus the logarithm of the probability of loss for a normal distribution, a stable distribution, and a power law distribution. The line for the normal distribution curves down, indicating that it has thin tails. In contrast, the line for stable distribution approaches the straight line of the power law because it is very similar to a power law for large losses.
These results show that the log-stable distribution does a good job of modeling the empirical returns distribution of the S&P 500. The better fit of the log-stable distribution demonstrates that the S&P 500 has fatter tails than predicted by the lognormal model. It also calls into question commonly used portfolio construction techniques such as the mean-variance optimization, which relies on the assumption of a finite variance.
If the log-stable model does such a better job in describing the distribution of asset returns, why has it not received more acceptance? There are several possible reasons. First, the mathematics is challenging. Second, the variances and all higher moments of stable random variables are infinite. The lack of a finite variance means that most portfolio theories and most portfolio construction techniques are invalid, including those based on alternative risk measures such as "downside risk." Finally, there is no single obvious way to estimate the parameters of stable distributions as there is with normal distributions.
Footnotes:
5. For an account of the work of Mandelbrot and Fama during this period, see Benoit Mandelbrot and Richard L. Hudson, The (Mis)Behavior of Markets, New York: Basic Books, 2004.
6. The idea of using fat-tailed distributions to model asset returns is starting to gain some traction. FinAnalytica was founded to provide investment analysis and portfolio construction software based on Mandelbrot and Fama's work. Morningstar added distribution charts and forecasting models based on it to Morningstar EnCorr.
7. Strictly speaking, the assumption is that the logarithm of one plus the return in decimal form follows a stable Paretian distribution.
8. This chart can be produced in Morningstar EnCorr Analyzer using the log-stable feature.
9. That is the probability distribution of one plus the return on an asset return in decimal form. The lowest possible return on an unleveled position in an asset is negative 100%, which is negative 1 in decimal form. Adding one we get 0. The logarithm of 0 is -(infinity).
This article first appeared in the February/March 2009 issue of Morningstar Advisor Magazine.


