If a recession is on the horizon as many expect, someone forgot to inform the stock market.
With the Morningstar US Market Index up about 8.6% so far in 2023 and 16.2% from the bear market low set in October, stocks are looking pricey by some widely used metrics.
That’s against the backdrop of an uncertain economic outlook where investors are weighing the potential for a recession against implications of still-high inflation.
"We still think the US equity market looks expensive and has been getting more expensive since the start of the year," says Jim Masturzo, chief investment officer of multi-asset strategies at Research Affiliates.
"The market is holding up well given the macroeconomic environment."
Some of the blame for the stock market’s pricey status can fall on the 2023 rebound in the big technology stocks that dominate the weightings in broad market indexes, such as Apple AAPL—up 35% in 2023—and Alphabet GOOGL—which is up 39% so far this year. That, say some strategists, has left large growth stocks particularly expensive.
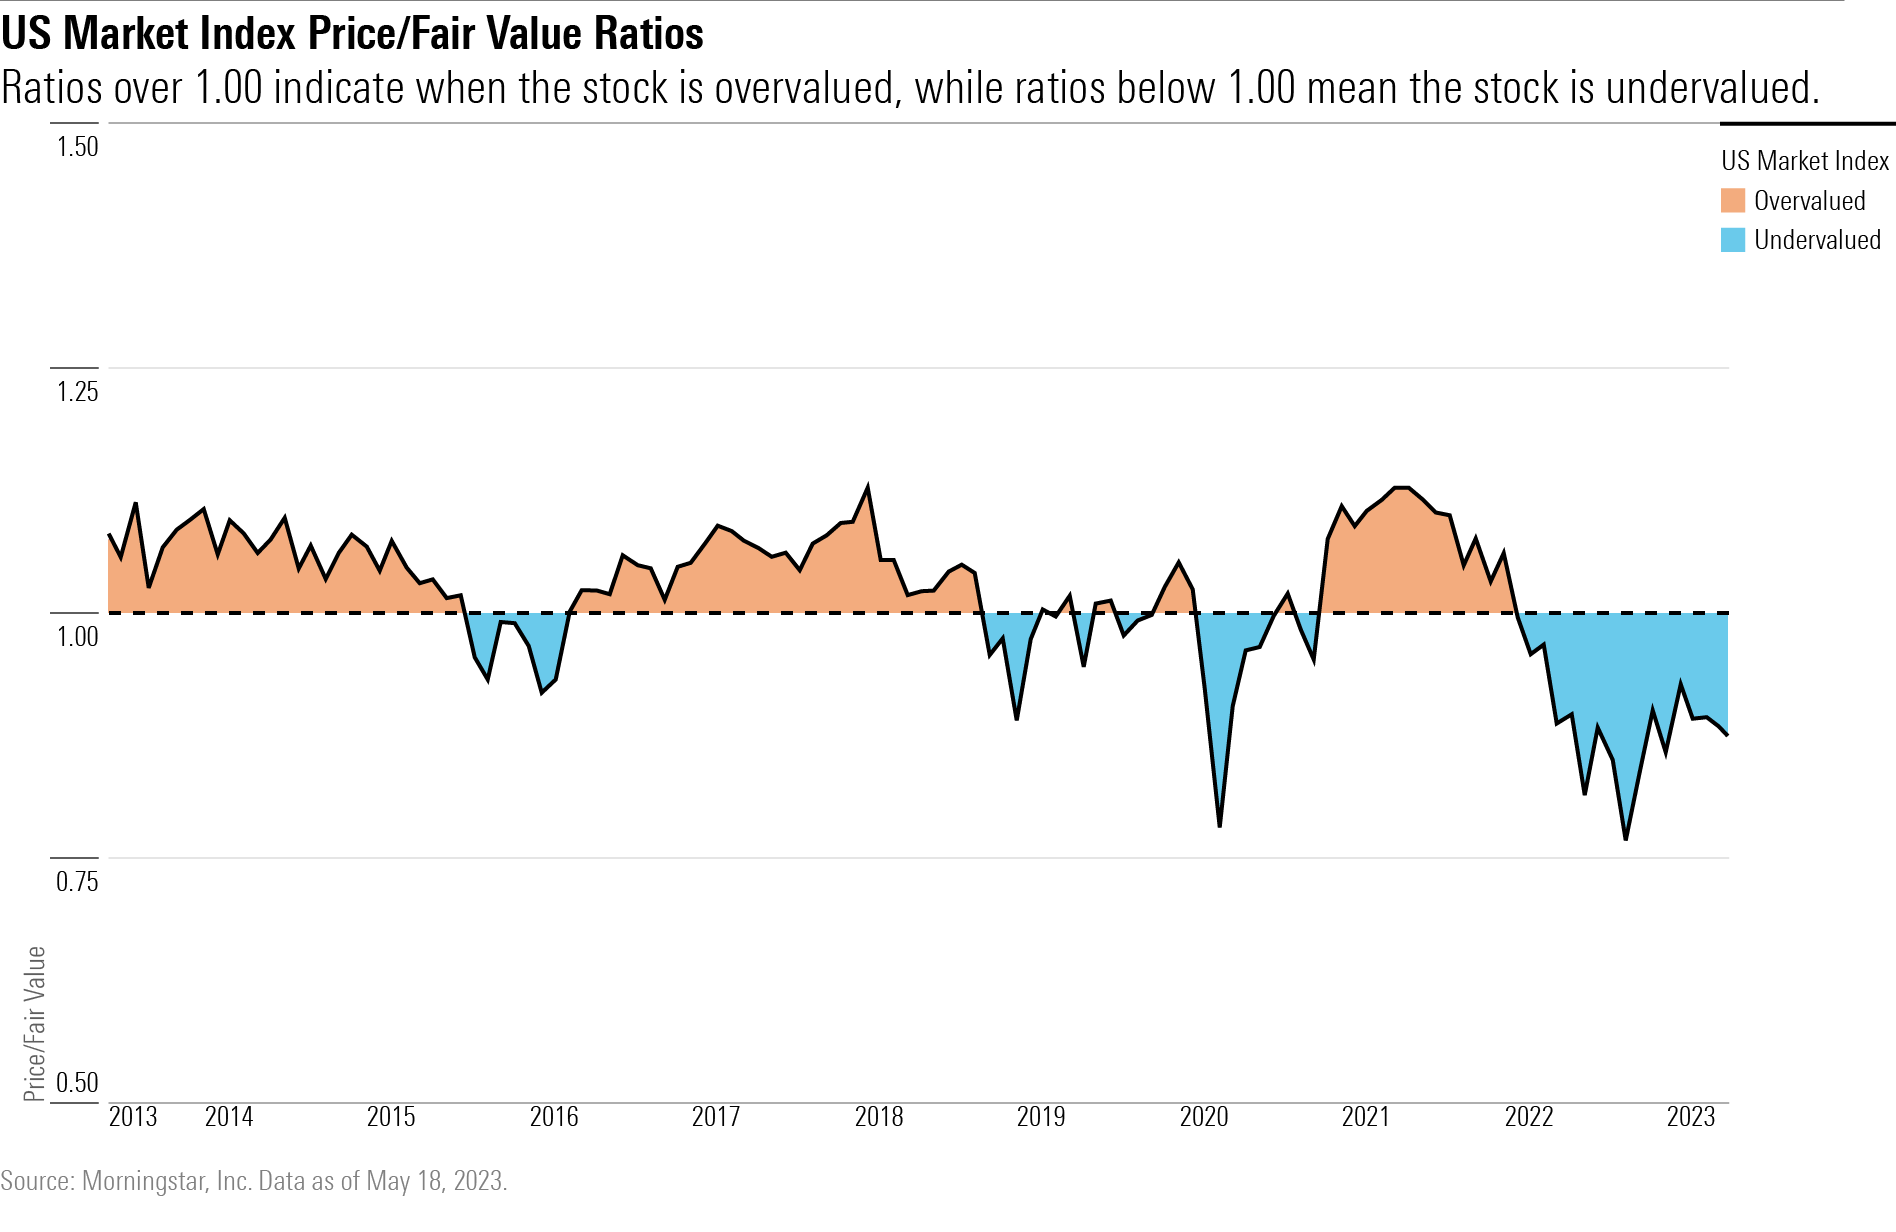
However, by Morningstar’s fair value estimate measures, stocks are actually undervalued by more than 9%, with value stocks looking particularly cheap. That market discount, however, has been narrowing significantly since the October low.
By P/E Measures, the Broad Market Looks Pricey
Investors have bid up stock prices as first-quarter earnings and revenue came in better than expected across a wide swath of industries, though overall earnings declined by 3% in the quarter and margins compressed.
Stocks also got a boost from optimistic expectations the Federal Reserve Board’s interest-rate tightening cycle is nearly over. Valuations have bounced back in the face of 10 interest-rate hikes in quick succession in the past year, high inflation, and a slowing economy.
Up 8.6% this year to date, the Morningstar US Market Index sports a price/earnings multiple of 19.8 times based on trailing 12-month earnings. That compares with a P/E of 24.2 times at its peak in late 2021 and 17 times at the low in mid-October 2022.
P/E ratios are a useful way to gauge the level of confidence that investors have in the ability of companies (or in this case an index of companies), what they are willing to pay for those earnings, and how much risk they are willing to take on. They’re a helpful tool to get a quick read on whether a stock, or a market index, is overvalued, fairly valued, or undervalued.
When looking at stocks based on expected earnings, the forward P/E on the S&P 500 is at about 18 times earnings, down from a peak of 21 times in January 2022 and above 15 times at the October 2022 lows, according to the Leuthold Group, a provider of financial research to institutional investors.
If the October low stands, it would mark the priciest bear market low in history, says Doug Ramsey, Leuthold’s chief investment officer. In comparison, the P/E at the Oct. 9, 2002, low was 13.5 times and the March 23, 2020, low was at 13 times.
"Large-cap stocks are expensive," Ramsey says. "They are not bubbly, but they are very high historically and relative to interest rates, liquidity, and inflation. It’s been a mania only partly deflated. They are not even close to discounting even a mild recession."
Cape Fear? Possibly...
When valuing the market, Jim Masturzo of Research Affiliates prefers to use the Shiller PE Ratio, named after Nobel Prize-winning economist and Yale professor Robert Shiller.
It is also known as the cyclically adjusted PE ratio, or Cape, because it is based on the inflation-adjusted earnings of S&P 500 companies from the previous 10 years to smooth out anomalies in the business cycle. The Shiller ratio was popularised during the dot-com boom when its levels exceeded 40 times earnings and Shiller cautioned stocks were overvalued.
"The Cape ratio takes a longer view of earnings,” says Masturzo. “It’s not as beholden to quarterly earnings releases."
Based on the Cape ratio, the stock market is looking expensive, but not at peak levels.
The Shiller ratio is now at 29.8 times earnings, down from 38.6 times in November 2021 when the market was at its frothiest, yet above the 27 times at the low in October 2022.
At the March 2009 low, the ratio valued the market at 15.17 times. So while the cape ratio is up from the levels of the October low, those levels in October still reflected a stock market trading at expensive prices.
FVE Suggest Stocks Are Undervalued
Morningstar’s senior US market strategist David Sekera take a different view.
He prefers measuring the market’s value by applying a price/fair value basis on a composite of the intrinsic value of the 700 stocks in the firm’s coverage list that trade on US exchanges, which he determines by comparing it with a composite of the market capitalisation of the entire universe of stocks in the Morningstar index.
Based on that calculation, Sekera considers the overall market undervalued at a 9.3% discount to intrinsic valuations. But the discount has narrowed considerably from his March calculations when it traded at a 12% discount and the 23% discount at the October lows.
He then notes the level of undervaluation was at its greatest discount to long-term intrinsic valuations since March 2020 and in 2011. Growth stocks were the most undervalued at the time and Sekera recommended investors buy the mega-cap technology names that had tumbled from lofty heights.
Big Tech Stocks Lead
Looking beneath the surface of the current market, it’s clear a small cadre of tech giants with the heaviest weightings in the indexes are responsible for much of the gains.
Microsoft MSFT, Apple, Meta Platforms META, Alphabet, Amazon.com AMZN, and Nvidia NVDA have been outperforming and leading indexes higher on investor enthusiasm about the growth prospects surrounding artificial intelligence technologies and an expectation that the Fed will ease later this year.
"They’re going back to the old generals because that’s what worked in the last battle," says Leuthold Group’s Ramsey, referring to a decade of outperformance from technology stocks before the Fed began lifting rates to fight inflation.
Conversely, there’s the sense some institutional investors with mandates to be fully invested in stocks and bonds are "hiding out in big tech stocks" and using the group as "cash surrogates," he says, noting the enormous amounts of cash the giant tech stocks generate.
"They are being viewed defensively, in the way that the drug stocks, consumer staples, and utilities used to be," he says.
He cautions, however, that the tech titans' revenue growth has been slowing and that’s evidence that the companies won’t be insulated from a downturn.
Sekera notes, meanwhile, that the growth stock Morningstar Category is up 15% year to date, almost double the broader index, and that the "easy gains are behind us". Warning of a "rough road ahead for the next few quarters," he expects economic growth to stagnate in the second quarter and contract in the third because of tighter monetary policy and declining credit availability before a "sluggish" recovery begins in the fourth quarter.
Value Stocks Undervalued
As a result, Sekera moved to his asset-allocation recommendation for growth stocks to market weight from overweight. Value stocks, trading at a 15% discount, retain their overweight rating as do small-caps, which trade at a 27% discount. The core/blend category, stocks with attributes of both growth and value, is now underweighted.
In the US, Masturzo notes that value stocks are cheap relative to growth stocks and he points to the materials sector trading at a P/E of 15 compared with an average closer to 18. Energy stocks are trading at a P/E of 7 compared with an average of 16.
Still, for better opportunities, "we continue to think globally," says Masturzo.
Outside the US, emerging markets trade at a P/E of 13.5 times, a 50% discount to the US, and developed markets trade at 18 times earnings, a 30% discount.
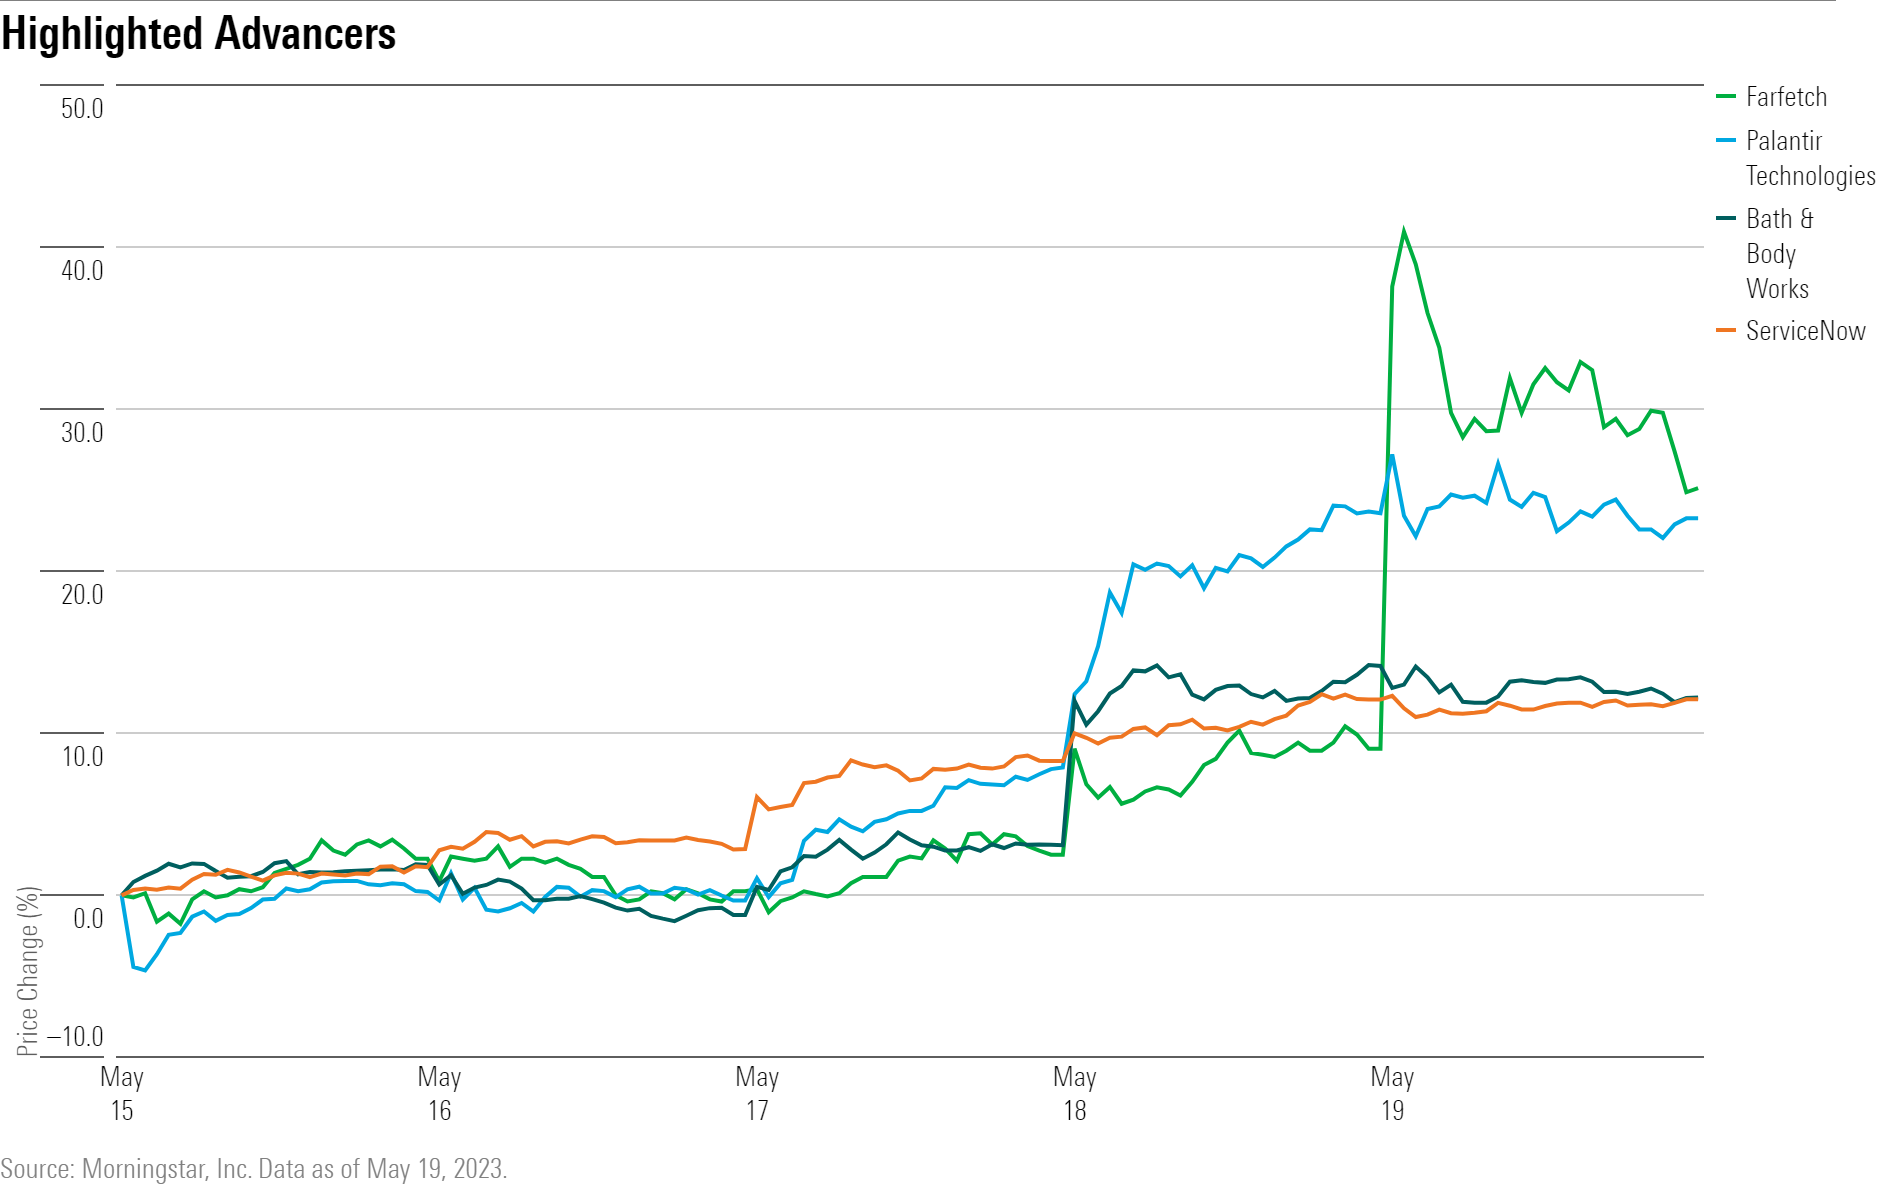
What Stocks Are Up?
Farfetch FTCH stock rallied following solid first-quarter earnings results. The luxury goods resale company posted a loss per share of $0.16 versus estimates of a $0.40 loss. Revenue also came in higher at $556 million versus estimates of $513 million.
The better-than-expected profitability was a result of the firm scaling down its spending in its demand-generation efforts. However, that "could have a detrimental effect on the company’s long-term growth," says Jelena Sokolova, senior equity analyst at Morningstar. Sokolova values Farfetch stock at $12.20 and still sees shares as cheap.
Palantir PLTR stock rallied after the firm posted its first quarterly profit under GAAP accounting measures.
"We believe the market has calibrated its valuation to reflect Palantir’s strong fundamentals that we have previously highlighted, and we view the firm’s shares as fairly valued," says Morningstar equity analyst Malik Ahmed Khan. He values Palantir stock at $9 per share.
Stronger-than-expected earnings results from Bath and Body Works BBWI lifted its stock higher. The firm posted earnings per share of $1.86 versus FactSet estimates of $1.62. Revenue also slightly beat estimates, coming in at $1.60 billion versus estimates of $1.56 billion.
ServiceNow NOW stock popped following its analyst day on May 16 where it announced several artificial intelligence solutions such as integrating its platform with OpenAI, the developers of ChatGPT. The firm also announced its first-ever stock buyback program of about $1.5 billion.
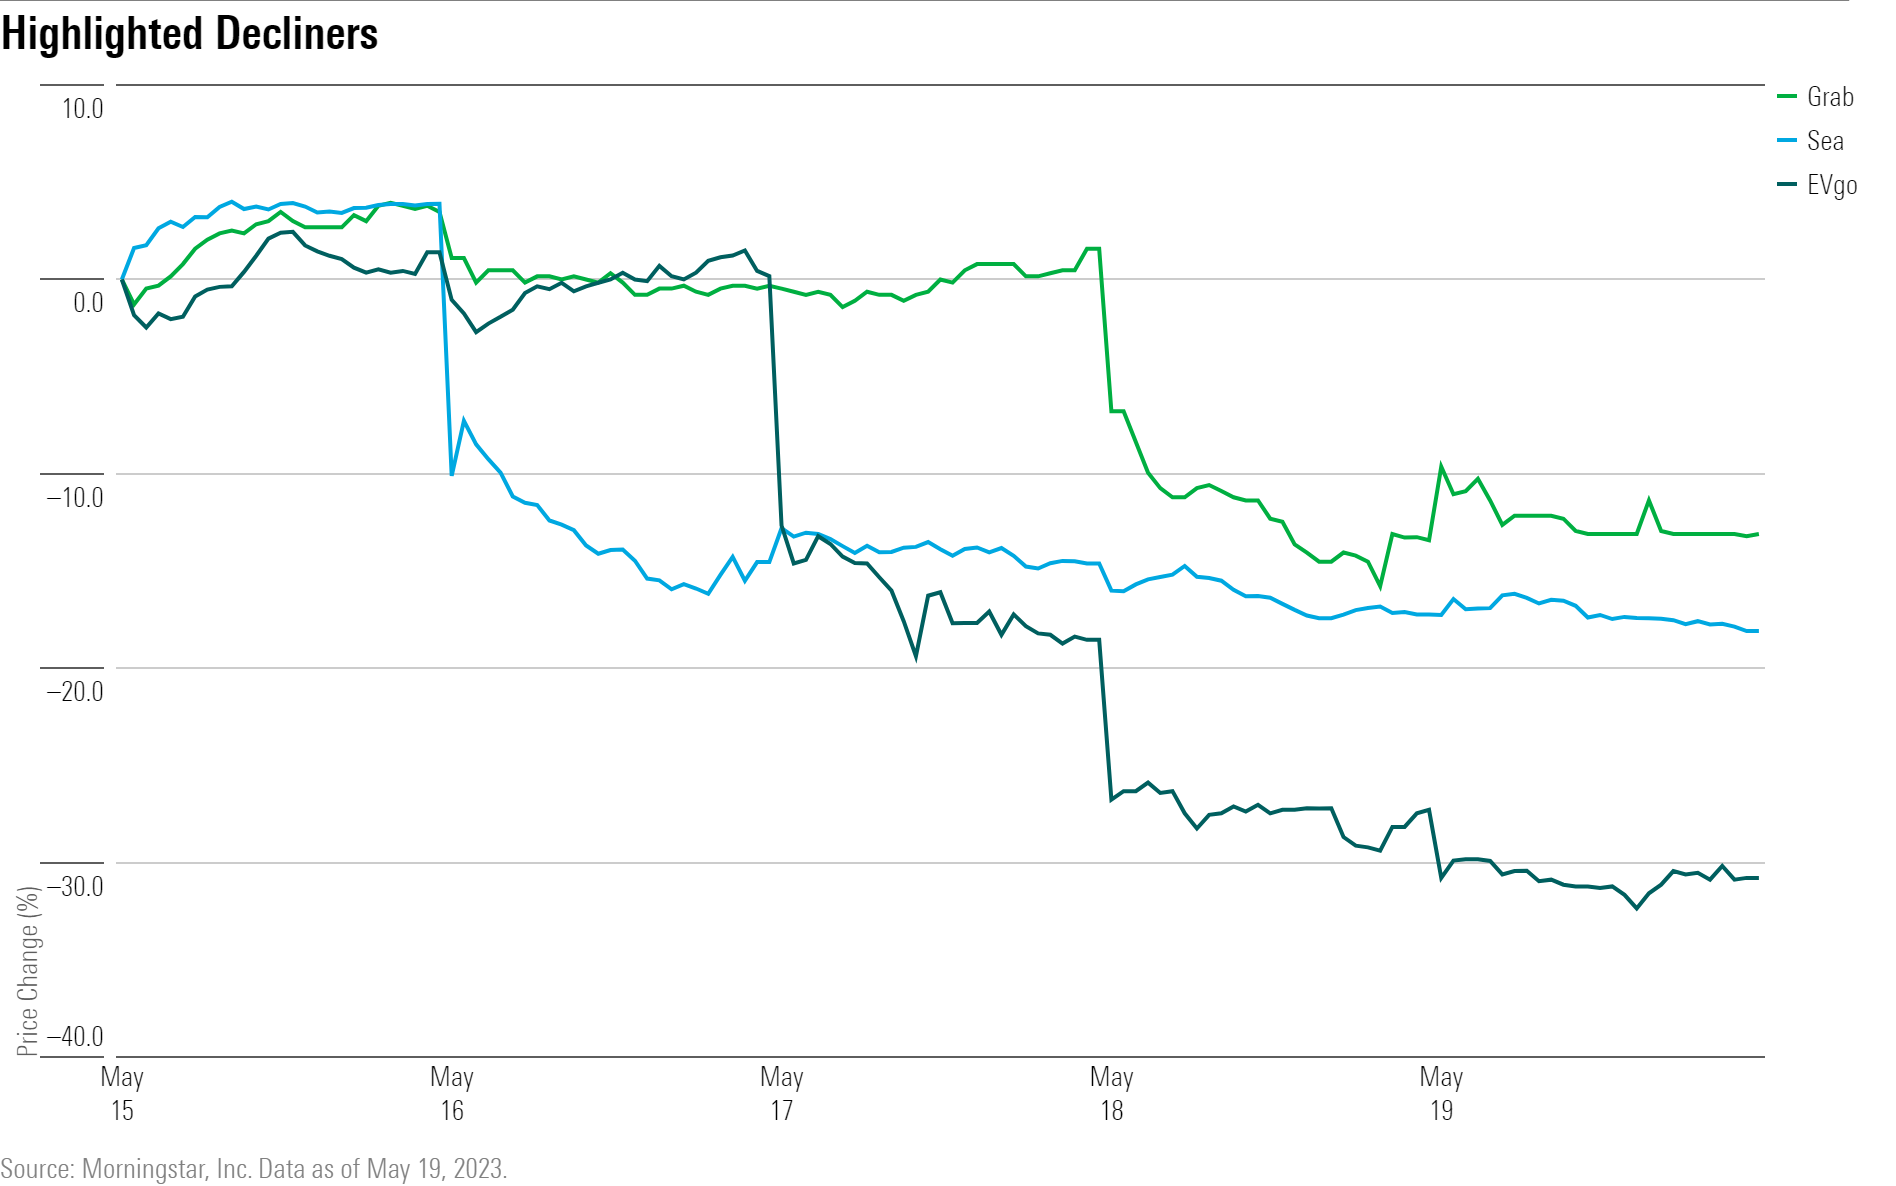
What Stocks Are Down?
EVgo EVGO stock plunged after the electric vehicle charging company announced a $125 million dilutive equity offering. The new stock shares were offered at $4.25 each, 26% below the company’s May 16 closing stock price of $5.73.
Morningstar equity analyst Brett Castelli views the move as "prudent," as he forecasts an "elongated path to profitability for the company (approaching breakeven in 2025-26) and thus supports the proactive approach to padding cash reserves given volatile capital markets," he writes.
Sea SE stock fell despite posting solid first-quarter earnings results, which showcased the e-commerce company posting its second-ever profitable quarter. The problem, Morningstar senior equity analyst Kai Wang says, is "we believe profitability was attained at the expense of GMV decline, and this raises doubts about whether Sea can achieve both growth and profitability at the same time".
Wang noted that while the company no longer reveals gross merchandise value data, it "indicated that GMV saw a similar trend in first-quarter 2022, when it declined 4% sequentially". He maintained his valuation of Sea stock at $70 per share after the results.
Grab GRAB, an Uber-backed UBER ride-sharing platform in Southeast Asia, saw its stock fall, showing a 9% year-over-year decline in gross merchandise value in its delivery segment.
Wang believes the market’s response is overdone as the firm still posted 46% year-over-year growth in its ride-hailing segment’s gross merchandise value.
"We believe Grab’s share price may have been dragged lower after slower growth in peer Sea as well as Alibaba BABA, again raising concerns over a consumption slowdown and intensifying competition," he says.