Inflation is the hot topic of early 2022 as energy and food costs spiral. From the Federal Reserve to the everyday supermarket shopper, the question is the same: why are prices rising so quickly and when will they stop?
Usually inflation data is left to economists, but this week how we measure the cost of living in has been in the spotlight after a campaign from food writer Jack Monroe.
In the UK our primary source of inflation data is the Office for National Statistics (ONS). According to the ONS, the Consumer Prices Index (CPI) rose to 5.4% in December, the highest level since March 1992. Everyone expects prices to rise over time, from houses to beer to first-class stamps.
In theory, wages rise too, although the decoupling of salaries and prices is the subject of great academic debate. The state pension (and certain other occupational pension schemes) are also linked to inflation changes, so the data matters a great deal. The inflation number is closely watched by the Bank of England, and that has a knock-on effect on the mortgages, personal loans and credit cards used by the average Briton.
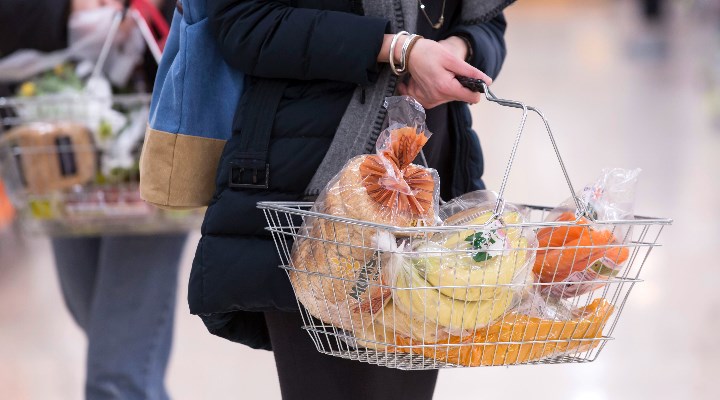
What's in Your Basket?
CPI is really just a dynamic theoretical basket of goods the average shopper buys (more of which later), and it's "weighted" based on how important they are. The “basket” itself consists of 700 goods at around 180,000 price points and includes food, petrol, clothing and other items. Changes are tracked monthly and yearly.
The ONS's basket is periodically shuffled to reflect shopping trends. Smart watches and hand gel were added in 2021, for example. You can see that the price of tomatoes is now at a record high of 241p per kilo, from around 37p per kilo in 1972, when the data set started. But bananas peaked in price in 1990 and have been heading downhill since. Most of these are imported so other factors are involved, which are usually beyond the control of British shoppers, including production, harvests, weather, political unrest and exchange rates.
CPI rising 5%, therefore, means the average item measured by the ONS is 5% higher than at the same point last year. There are other inflation measures; the ONS’s preferred measure is CPIH, which includes housing costs for owner occupiers. The Retail Price Index (RPI), meanwhile, is usually higher than CPI, is used by train companies to set annual rail fares).
But there is a problem. How can one monthly number, released two weeks after the month ends, capture the complex economic reality of Britain’s different social groups?
Some people have saved a lot during lockdowns, while others have been on furlough and in dire financial straits. Everyone has to eat and most people travel for work (using a car or train), but beyond that each person’s financial profile is different. Ultimately the ONS data is a “snapshot” in time and doesn’t factor in the wealth or income of the person spending. Jack Monroe wants to change that.
She argues that, for some basic food stuffs like rice, pasta and stock cubes, prices have rocketed way beyond the official measures, hitting the poorest members of society hardest.
After launching her campaign the ONS has agreed to publish an alternative inflation measure, named the Vimes Boot Index after a Terry Pratchett character. She says the aim is to release the figures around the time of the next official CPI data in February. Monroe is approaching the inflation debate from the food angle, but there are real concerns over fuel poverty this year ahead of the lifting of the Ofgem price cap in April too.
Smarter Data
The ONS itself is re-starting a series of “experimental statistics” on inflation data at different income levels, a series that was launched before the pandemic but was then disrupted as statisticians had to adapt to working from home and focus on producing the daily Covid statistics. The series is re-launching on Friday, January 28 and will be separate from the index Monroe has been campaigning for, which will run alongside the official figures.
“We will continue to produce our headline inflation statistics, which are long-running and follow international best practice,” the ONS said.
But it also insisted the inflation data is also being worked on to improve its accuracy. One idea is to expand the data points from 180,000 to hundreds of millions.
“We are continuing with longer-term plans to improve our inflation figures by including data from supermarket checkouts, which will help us understand people’s experience of inflation in a much more detailed way,” the ONS said.
So, in the era of big data, when statisticians use ever more sophisticated models and data sets to produce a monthly number with the power to surprise and dismay poverty campaigners, this topic has a long way to run.
After the financial crisis, the media was transfixed by GDP figures. Now inflation has its moment in the sun again, and it looks unlikely the debate will itself be transitory.