The story of global equity markets over the past 10-plus years can be encapsulated by two big-name stocks: Nestle and Nvidia.
The former is the well-known Swiss food and beverage manufacturer that employs nearly 300,000 people. Nestle (NESN) has a forward dividend yield of roughly 2.4%, has grown earnings at a rate of about 5%, and is trading at a healthy trailing price/earnings ratio of around 22.
Nvidia (NVDA), meanwhile, is a US-based technology company, the leading designer of graphics-processing units used for gaming and cloud applications. It has fewer than 14,000 employees. The stock sports a meagre dividend yield of barely 0.1% and a relatively lofty P/E ratio of 85 times trailing earnings, but it has been growing earnings at a rate of 32%.
The past decade has belonged to the Nvidias of the world. In 2010, Nvidia was the 731st-largest constituent in the Morningstar Global Markets Index and Nestle the fourth. As of year-end 2020, Nestle had slipped to 17th slot but more tellingly, Nvidia clocked in at number 20, helped by a 122% return last year. (Nestle was up 14.8% in 2020.)
Nvidia's meteoric growth represents a period in which global equity markets were dominated by high-priced technology-related stocks low on dividends, mostly from the United States and China. As a recently published report looking at changes to Morningstar Equity Indexes demonstrates, equity markets today bear resemblance to the late 1990s. What followed that boom was a decade led by stocks outside the U.S. and value over owth.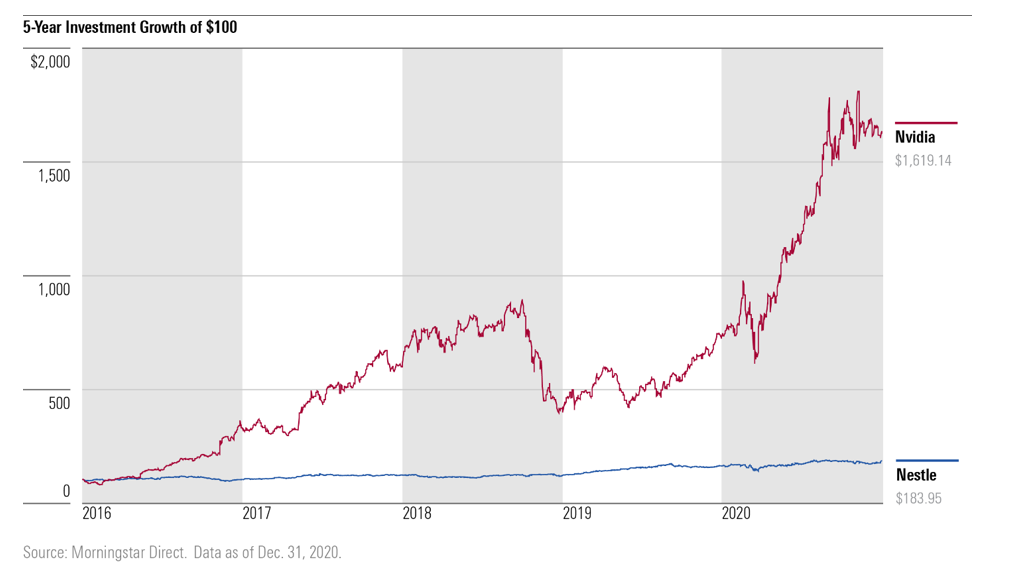
The Morningstar Global Markets Index
The pandemic-driven market of 2020 only accelerated long-running trends in global equity markets. Technology-related stocks, especially in the US and China, benefitted from work-from-home, shop-from-home behaviour. Losers included the energy sector and financial services. November saw promising vaccine results lift economically sensitive stocks, but only time will tell if the sectoral rotation will last.
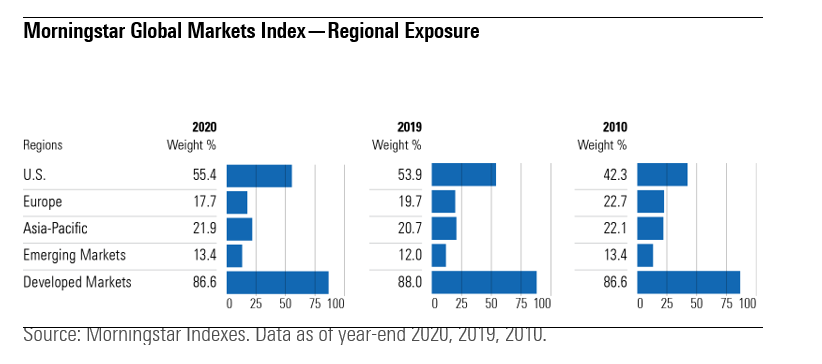
Comparing the composition of global equity markets at the end of 2020 to their state in late 2010 reveals more a dramatic change. At the end of 2010, Exxon Mobil was the world's largest public company; the US was 42.3% of global market capitalisation, the Morningstar Global Markets Index had a trailing 12-month Price to Earnings Ratio of 14.3 and a yield of 2.2%. Today's largest companies are mostly American or Chinese and several of these were not even public in 2010.
Meanwhile, Europe has seen its relative position within global equity markets slip, standing at 17.7% by the end of 2020, down five percentage points from 2010. The European equity market has been far less dynamic than the US or Asia Pacific.
Sector weights have been more stable, however, and today's leaders were also big 10 years ago. Nestle was the largest public company in both December 2010 and December 2020. As the UK exited the European Union, it remained Europe's biggest equity market but saw its share fall to 23.1% within Europe, down from 31.2% in 2010.
The US has become a highly concentrated, technology-dominated market. Last year saw the technology sector's weight within the Morningstar US Market Index rise by 5 percentage points to make up a quarter of the index. The consumer cyclical sector also saw its weight rise thanks to Amazon.com (AMZN) and Tesla (TSLA). Meanwhile, energy's share within the index almost halved to 2.1%. Amazingly, energy stocks represented 11.3% of index weight in 2010. The top 10 holdings also now represent nearly a quarter of the index, compared to less than 16% in 2010.
Emerging markets’ share within global markets has not changed meaningfully in recent years, but its composition certainly has. The dramatic rise of China has been mirrored by a decline in Brazil, Russia, and South Africa, all of which are linked to natural resources. Markets heavier on tech-related businesses, such as South Korea, Taiwan, and India, have also gained ground.
Where Do the Markets Go From Here?
In life and in investing, change is the only constant. By the end of 2021, global equity markets may look the same as today or be completely upended. The long-term outlook is even hazier. Equity market leaders of 2030 may not even be public companies today, as the meteoric rise of Facebook (FB), Alibaba (BABA), Tencent (00700), and Tesla over the past decade demonstrates. Meanwhile, it is hardly inevitable that today's market leaders will diminish. Nestle has proved remarkably enduring, as have companies like Toyota (TYT), Johnson & Johnson (JNJ), and Roche (RO).
Longtime contrarians will testify that just because a sector is currently depressed does not mean that rebound is imminent. The traditional energy sector could face permanent impairment as the world transitions to renewable energy sources, while technology could continue to benefit from global digitization.
With the caveat that share prices can diverge from intrinsic values for extended periods, here are some insights at the start of 2021 based on Morningstar's stock valuation metrics.
• Stocks in value sectors, most significantly energy, present the best valuation opportunity going forward.
• Expectations for the technology sector implied by current valuations may be overly optimistic. Many tech-related market leaders, including Apple, Tesla, and Nvidia, are considered overvalued.
• On a geographic basis, valuations look more attractive outside the United States. Europe presents some valuation opportunities, including the beaten-down U.K. market. Japan holds areas of opportunity as well.
• Some emerging markets look attractively valued, including resources-linked Russia and Brazil.