The 60:40 portfolio has gained legendary status for its performance consistency. Simply put, a medium-risk investor with 60% in global equities and 40% in global bonds has been able to ride the ups and downs of market cycles over the years and come out relatively unscathed.
Achieving this mix with tracker funds, means no decisions on asset allocation, no worries about fund managers departures, and no need to think about tactical investment choices. Of course, one would need to re-balance, say on a quarterly basis, to come back to target weights.
But historically, such a strategy hasn’t been readily available to advisers or retail investors. That situation has changed over the past decade, with the rapid acceleration of the ETF market, and it's now simple to build such a portfolio in just a few easy steps.
We have put to the test how such a portfolio has performed from January 1, 2008 to March 31, 2020. We have assumed a 0.2% annual charge and a quarterly rebalance to ensure the proportions stay at 60:40. The equity portion of the portfolio is represented by the MSCI World Index and the fixed income part by the Bloomberg Barclays Global Aggregate (GBP hedged) index. These are two indices which are now easy and cheap for investors to track, even if they weren’t back in 2008.
Over this period as a whole the composite index has delivered a total return of 117.8%. That compares with 141.4% for global equities and 66% for global bonds (hedged into sterling). But it’s not just the headline numbers we need to look at – the swings along the way, bookended by two large sell-offs, give a better picture of the journey.
How Long Does it Take to Bounce Back?
Peak to trough analysis shows the crash of 2008 saw the most prolonged falls over this period. Equities were already on a downward slope at the start of 2008; while they started to turn up in March 2009, it took years to return to January 2008 levels. The 60:40 composite on the other hand, enjoying the ballast of the bond element, recovered its losses by the end September 2009.
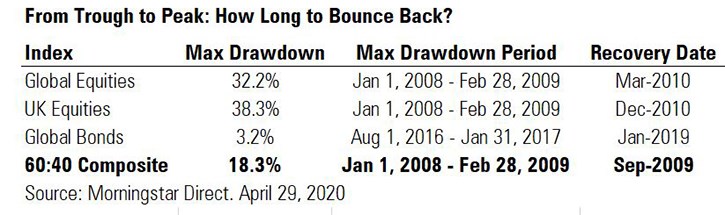
Here we can see that equities endured far greater drawdowns. While we use UK equities as one comparison, it’s worth pointing out that the average fund in the GBP Moderate Allocation has only around 16% of assets in UK shares – a figure which has nearly halved from a decade ago. Meanwhile, the UK represents just 5% in the global equities index.
Rolling Returns
Next, we look at performance over rolling time periods, with 148 rolling three-year windows between January 2008 and March 2020.
The 60:40 composite has, impressively, achieved positive gains 96% of the time during that period. Its worst single three-year period was to the end of February 2009, when it had seen falls of 9.9%. Despite the current market turmoil, the most recent three-year period posts a gain of 8.9%.
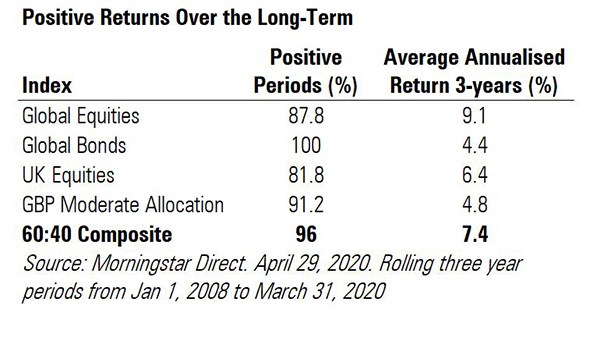
In comparison, equities have remained positive 87.8% of the time and returned 146.1% that’s nearly 30% more than the composite index, but the extent of the drawdowns has been much more severe. The worst three-year period, for example, saw a fall of 25.1%. Global bonds posted an extraordinary 100% success rate for staying in positive territory. The results show that staying the course for the long-term and being diversified help to form part of a successful investment strategy.
Year-by-Year Performance
Calendar year performance shows the extent to which the composite index has dodged some bullets as well as delivering in rising markets. By comparison, the average performance of the most comparable Morningstar Category – GBP Moderate Allocation – has tended to perform worse on the downside.
The 60:40 composite’s exposure to western government bonds has helped; these make up the majority of its fixed income allocation and have rallied at times of market stress. But as yield on these bonds have fallen, many investors have felt there isn’t enough of a margin of safety to warrant holding them, a situation exacerbated by the Covid-19 crisis, when we saw a multitude of yields turn negative.
A huge rally in US stocks over the past decade has also been a major boon to the 60% of the index invested in equities. Even this year, big tech names have held firm and a weak pound has further boosted returns.
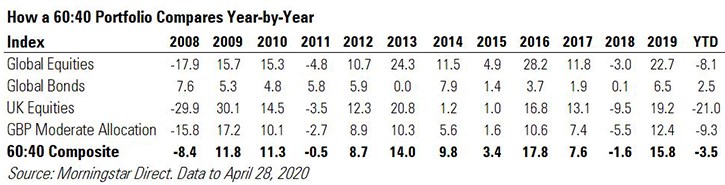
Of course, it’s worth pointing out that low yields and rising inflation means government bonds may not come to the rescue in future sell-offs. Meanwhile, the UK market languishes 20% lower than it started the year, hurt by its large exposure to oil and gas, materials and banks.
Does a 60:40 Approach Work?
Looking at the historical path of the much revered 60:40 index, its positive attributes are overwhelming. At the same time, critics suggest this may not continue. They point to the exposure of such a portfolio to unsustainably low government bond yields, which in future are unlikely to provide the cushion we’ve become used to across the thirty-year rally in bonds.
But while sceptics have, over the years, read the 60:40 its last rites, the strategy has stayed alive and well. The future may be different from what we have observed over recent decades, but even in this sell-off, it’s put up a fairly resolute fight.
Find out how to Build a Balanced Portfolio in 3 Simple Steps