
Just how “made in America” are United States stock funds? It turns out they’re not as wholly American as investors might think - nor are funds based in other countries exclusive to their respective areas.
When it comes to assessing the asset-allocation characteristics of a mutual fund, some aspects, such as market capitalisation, aren’t difficult to measure. Geographical diversification of allocations, however, can be more complex.
Investors may base their plans for geographical diversification on information like where a company is headquartered or incorporated, or where the stock is listed—but these items don’t always tell the full story.
Take Aflac (AFL), which is headquartered and listed in the US, but generates 69.8% of its revenue in Japan. This type of exposure means that in the short term, Aflac shares tend to fluctuate more in tandem with the US stock market; in the long term, its business prospects are more closely aligned with Japan.
Analysing Revenues by Region
To help paint a more accurate picture of a portfolio’s geographic allocation, Morningstar has introduced proprietary global geographic segment data: The Revenue Exposure by Region tool enables investors to assess a fund’s geographic exposure based on the revenue streams of the companies it holds.
Our new white paper, A New Perspective on Geographical Diversification, provides more details on the methodology behind these calculations.
How Geographic Diversifcation Varies in US ETFs
Key differences can emerge when investors base asset allocation on revenue exposure by region, as opposed to “business country” factors, such as where a company is headquartered. Below, we highlight what these differences look like in three popular US index-tracking, exchange-traded funds.
1. SPDR S&P 500 ETF
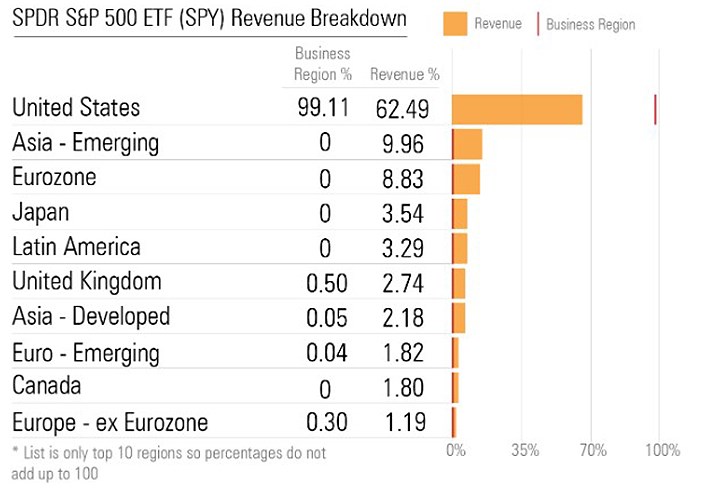
SPDR S&P 500 ETF, which has a Morningstar Analyst Rating of Gold, is the most widely followed US equity benchmark. The fund’s portfolio lists the US as its business country for essentially all its assets—but as you can see on the chart below, the map looks decidedly different when viewed through the prism of revenue by region.
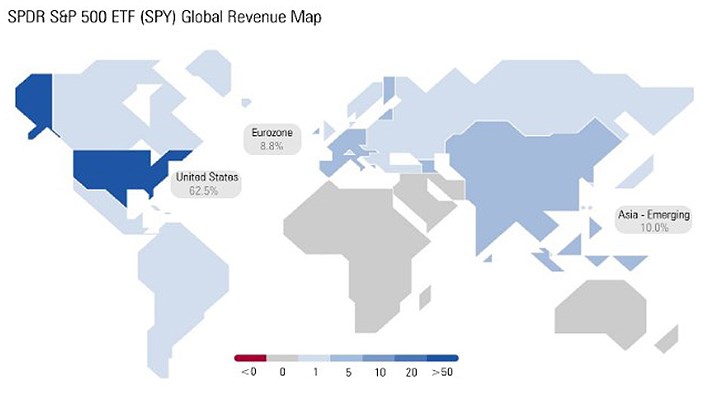
The map shows that only 62.5% of revenue from companies in SPDR S&P 500 originates in the US. Beyond that, a substantial amount of revenue is generated from Asia’s emerging markets (10%), which include mainland China, India, and the Middle East. Another 8.8% comes from countries in the eurozone.
Additionally, the white paper notes that geographical diversification of revenue can vary significantly across a fund’s sectors, which in turn aggregates to the overall fund. For example, technology is the most multinational sector, while utilities, real estate, and financial services are the most domestically focused.
This trend surfaces in SPDR S&P 500 ETF, where three of the top five holdings are technology stocks: Microsoft (MSFT), Apple (AAPL), and Facebook (FB). As a group, these firms are main drivers of the fund’s eurozone and emerging-Asia exposure (as shown in the table below).
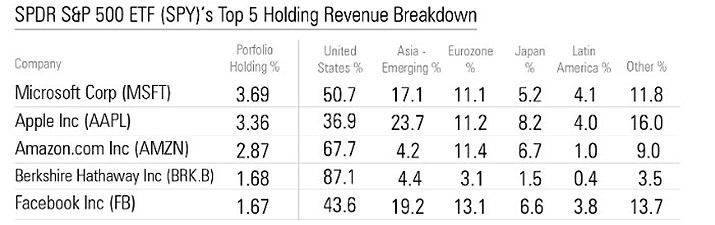
That said, there are also plenty of US-based holdings in the SPDR S&P 500 ETF that earn the majority of their revenue streams from the US. For instance, the fourth-largest holding, Berkshire Hathaway (BRK.B), earns 87.1% of its revenue domestically; the 12th-largest position, UnitedHealth Group (UNH), earns 96% of its revenue from the US.
2. Vanguard Total Stock Market ETF
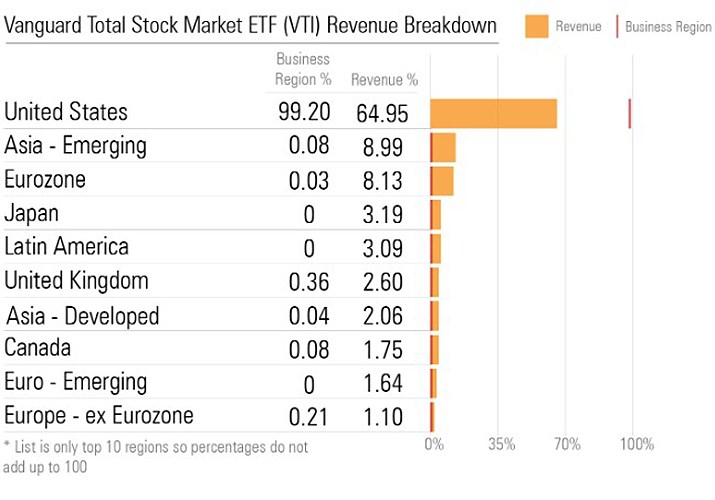
Vanguard Total Stock Market ETF, which also is a Gold-rated fund, posts similar revenue-by-region metrics. The fund tracks the CRSP US Total Market Index and, like the S&P 500, is market-cap weighted. Similar to SPDR S&P 500 ETF, the Vanguard Total Stock Market ETF’s top holdings include Microsoft, Amazon.com (AMZN), Apple, and Facebook.
As the chart below shows, those names are significant contributors to the fund’s revenue base in emerging Asia and eurozone countries.
Although revenues in financial-services companies are primarily earned domestically, Citigroup (CITI) and Goldman Sachs Group (GS) buck that trend.
Citi is headquartered in the US, but only generates about half its revenue (47.9%) domestically. Other substantial contributors include Japan (20.2%) and Latin America (13.3%).
Similarly, Goldman generates 45.4% of its revenue in the US, 15% in Australasia, 12% in the eurozone, and 11% in Latin America.
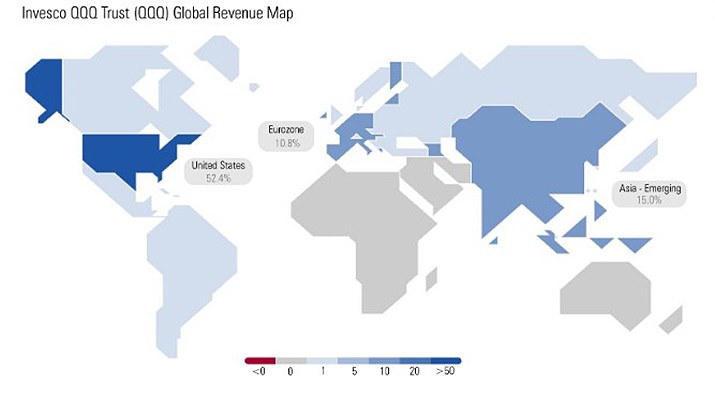
3. Invesco QQQ Trust
Invesco QQQ Trust, which has a Morningstar Analyst Rating of Neutral, tracks the Nasdaq-100 Index and has major weightings in large multinational technology companies. Consequently, this ETF barely cracks the 50% mark in revenue from the U.S.
Although Invesco QQQ Trust’s top holdings are the same as SPDR S&P 500 and Vanguard Total Stock Market (Microsoft, Apple, Amazon.com, and Facebook), this fund is concentrated more on these specific stocks. The fund has about 33.3% of its assets in these four holdings, while they comprise only about 10% of the assets in the other two.
Also contributing to the multinational state of Invesco QQQ Trust is Broadcom (AVGO), which comprises 1.5% of the ETF’s assets. While Broadcom generates only 7.2% of its revenue from the U.S., it generates 57.2% from emerging-Asia countries and 11.4% from countries in the eurozone. Similarly, Booking Holdings (BKNG), which is the 20th-largest holding in the fund, is a major source of Invesco QQQ Trust’s eurozone revenue base—generating nearly 78% of its revenue in that region.
Another large multinational tech position is Intel (INTC), whose revenue breaks down to: 20%, US; 40.9%, Asia - Developed; 24.6%, Asia - Emerging. There’s also Adobe (ADBE), which generates 52.5% of its revenue in the US, 13.3% in the eurozone, and 7.2% in Japan.
With Morningstar’s Revenue Exposure by Region data, you can evaluate the nuances of a portfolio more comprehensively. Ultimately, investors, advisors, and analysts can have better insight into the market changes that will impact a portfolio and craft the right strategies in response.