.jpg)
While the "Magnificent Seven” are exclusively US tech stocks, its European counterparts are smaller in market value, but more diversified, very profitable and on average cheaper.
In 2020, investment bank Goldman Sachs released its first iteration of the GRANOLAS, an acronym for the following:
• GSK (GSK)
• Roche (ROG)
• AstraZeneca (AZN)
• ASML (ASML)
• Nestle (NESN)
• Novartis (NOVN)
• Novo Nordisk (NOVO B)
• L’Oreal (OR)
• LVMH (MC)
• AstraZeneca (AZN)
• SAP (SAP)
• Sanofi (SAN)
What do the Granola Stocks Have in Common?
Those companies were among the most valuable in the continent but also had several strong characteristics: solid earnings growth; defensive and low volatility; high and stable margins; strong balance sheets; vompounders with sustainable dividends.
In a report released on April 28, 2020, the bank’s strategists wrote: “In the US, tech is still likely to remain the long-term winner. In Europe it’s more likely to be a combination of structurally strong and/or stable sectors: healthcare, consumer staples and tech. The largest stocks in these spaces we’ve dubbed the ‘GRANOLAS’: GlaxoSmithKline, Roche, ASML, Nestle, Novartis, Novo Nordisk, L'Oreal, LVMH, AstraZeneca, SAP, Sanofi. They might not ALL do well, but they generally have some growth and/or stability in earnings and DYs in the 2-2.5% range.”
The bank updated its views last week, underlying the fact that the GRANOLAS stocks had little to envy the US’s “Magnificent Seven”, an expression that has been attributed to Bank of America’s strategist Michael Hartnett, in reference to the 1960s movie (itself a remake of Akira Kurosawa’s masterpiece, Seven Samurai, released in 1954).
Starting from their research, we looked at the most valuable companies in the Morningstar Europe index and also extracted valuation and fundamentals data from other databases to understand the underlying drivers of the outperformance, looking back to 2021.
No Trillion Euro Stocks - Yet
First of, there are no trillionaires (yet) within the list when compared to the US counterpart which already had five at the end of January. The most valuable company in Europe is Novo Nordisk, the Danish pharmaceutical company whose Ozempic obesity drug has helped propel its earnings to new highs with a market value of €400 billion.
The “smallest” of the European Magnificent Seven (M7) is luxury company Hermès International, worth €200 billion (see table).
Some investors have started wondering when we will see a trillion-euro company in Europe. One might just need to wait for a new wave of irrational exuberance, but unless the “obesity cure” becomes as exciting as AI, this might not come any time soon.
Europe's Global Leaders
The second big difference with its US equivalent is the diversity of sectors represented within the list.
The list has a tilt towards healthcare (32%), consumer defensive (26%), consumer cyclicals (29%) and tech (14%).
While the US version of the M7 is only tech, its European counterpart has only one – ASML which is not a software or an Internet company, but the global supplier of vital production equipment to the global semiconductor industry.
One characteristic of the list is that it is home to global leaders in their respective fields: Nestlé for food, LVMH for luxury, L’Oreal for cosmetics, Novo Nordisk for diabetes.
It is also populated with some of the largest pharmaceutical companies in the world, notably Roche. The list in the table also includes Novartis, Sanofi, AstraZeneca and GSK which are among the top 10 largest pharmaceutical companies in the world.
Since 2021, the average return of the European M7 companies has been very solid. On a total return basis in euros, an equally weighted portfolio of the companies would have doubled in value, with a cumulative total return of 103% as of Feb 19, compared with a cumulative total return of 128% for its US counterparts.
Europe and Magnificent 7 Stocks vs the Stoxx 600
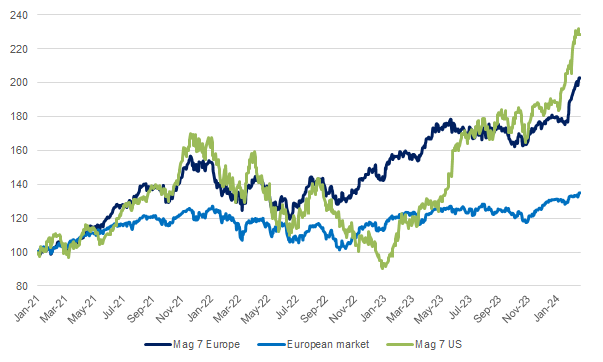
Source : Morningstar Direct, Factset : Morningstar Direct, Factset. In euros. Total return. Base 100 = January 1 , 2021
We looked at historical return on equity as a measure of profitability. This measure is far from perfect, in particular for companies whose profitability has been driven mostly by intangible assets, be it brands, patents or client relationships.
Yet it gives an idea of how profitable the M7, both in Europe and the US, are.
Europe and Magnificent 7 Stocks - Return on Equity
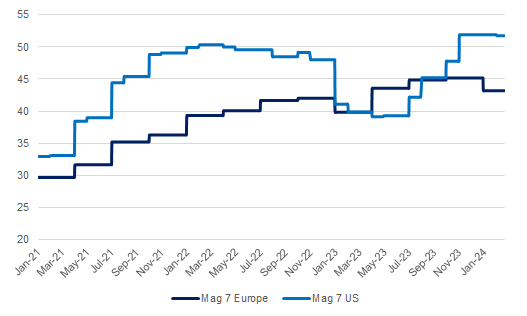
Source : Morningstar Direct, Factset : Morningstar Direct, Factset. In % from Janaury 1, 2021.
This chart shows several things. First, both groups have seen their return on equity improve over the last few years. Second, despite being more volatile, the M7 of the US have been significantly more profitable than their European counterparts.
European Stocks at a Discount
Finally, we can look at valuations. The table below gives some useful information based on Morningstar proprietary metrics, which can be useful to help investors pick investment ideas.
We also looked at more classical valuation ratios using consensus data to assess if the higher profitability of the US M7 is justified and if they trade at a premium to their European counterparts.
The chart below shows that thanks to increasing return on equity, the valuation ratios has been declining over the last few years.
But despite this decline, both sets of stocks trade at a significant premium to their respective markets.
Magnificent 7 Stocks Trade at 31x Earnings
In Europe, the Magnificent Seven subset currently trades at 31 times earnings expected for the next twelve months, based on consensus data from Factset, which a historical average of 30 times since 2021. This compares with a European market that currently trades at 13 to 14 times forecasted earnings.
In the US, the M7 currently trades at 34 times earnings, compared with a historical average of close to 40 times since 2021 (they also trade at a premium to the US market which trades at about 20 times earnings).
The historical premium of the US M7 to their European counterparts makes sense considering their higher return on equity.
And the European list, which is equally weighted, is influenced by the very high valuation of specific companies, especially ASML and Hermès International which trade at a P/E multiple of circa 43 and 49 times respectively.
P/E Ratio of European and Magnificent Seven Stocks
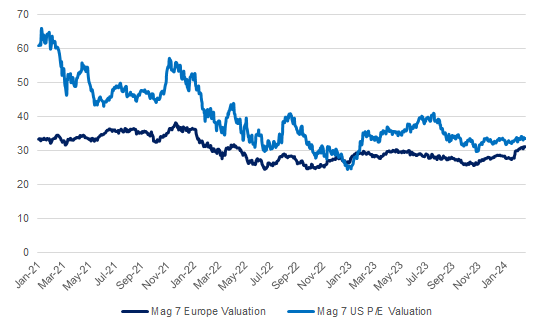
Source : Morningstar Direct, Factset : Morningstar Direct, Factset. In % terms from Janaury 1, 2021.
Overall, the European version of M7 has provided very solid returns to investors, not far from their US counterparts. The subset is on average smaller, but more diversified than the US counterparts. Their high profitability justifies valuation premiums to the rest of the market. But the fact the US cohort is even more profitable explains why the European version trades at discount to its US counterparts.