
For over a year now, the bond market’s most widely followed predictor of an economic downturn has been flashing a clear warning sign: short-dated bonds have been yielding more than longer-term ones. Yet not only has the economy not slid into a recession, but there are even signs that it’s gaining strength.
Take the Federal Reserve Bank of Atlanta's GDPNow measure, which attempts to provide a real-time picture of economic growth. It’s suggesting the US economy is growing at a torrid 5.8% pace in the third quarter.
In fact, investors are so convinced a recession isn’t coming that in recent weeks, bond yields have been rising, in some cases to their highest levels since before the 2008 financial crisis.
Does this mean that what Wall Street calls the inverted yield curve has failed as a bellwether this time around? Not so fast, say some bond market veterans.
"We’re 13 months or so into it now," says Duane McAllister, portfolio manager at Baird Asset Management. While widespread expectations that a recession would have taken hold by now have been proven wrong, "I don’t think this time is different," he says. "I think the yield curve will once again be proven a good predictive indicator for the market and the economy."
McCallister and others point to several reasons the economy has been able to keep trucking along in the face of an inverted yield curve. Most notably, there are the lingering effects of the massive fiscal and monetary stimulus efforts during the COVID-19 pandemic, as well as the long lag time before the Federal Reserve’s rate hikes filter through to the economy.
"There are reasons it hasn’t had a bigger impact right now," says Mark Lindbloom, portfolio manager at Western Asset Management, but "the yield curve is an important indicator […] we’re not willing to exactly write it off."
Investors also often ignore the impact an inverted yield curve itself will have on the economy. But such impacts take time. "The markets want to run away with things right away. Of course, in the real world it doesn’t work that way," McCallister says.
What is a Treasury Yield-Curve Inversion?
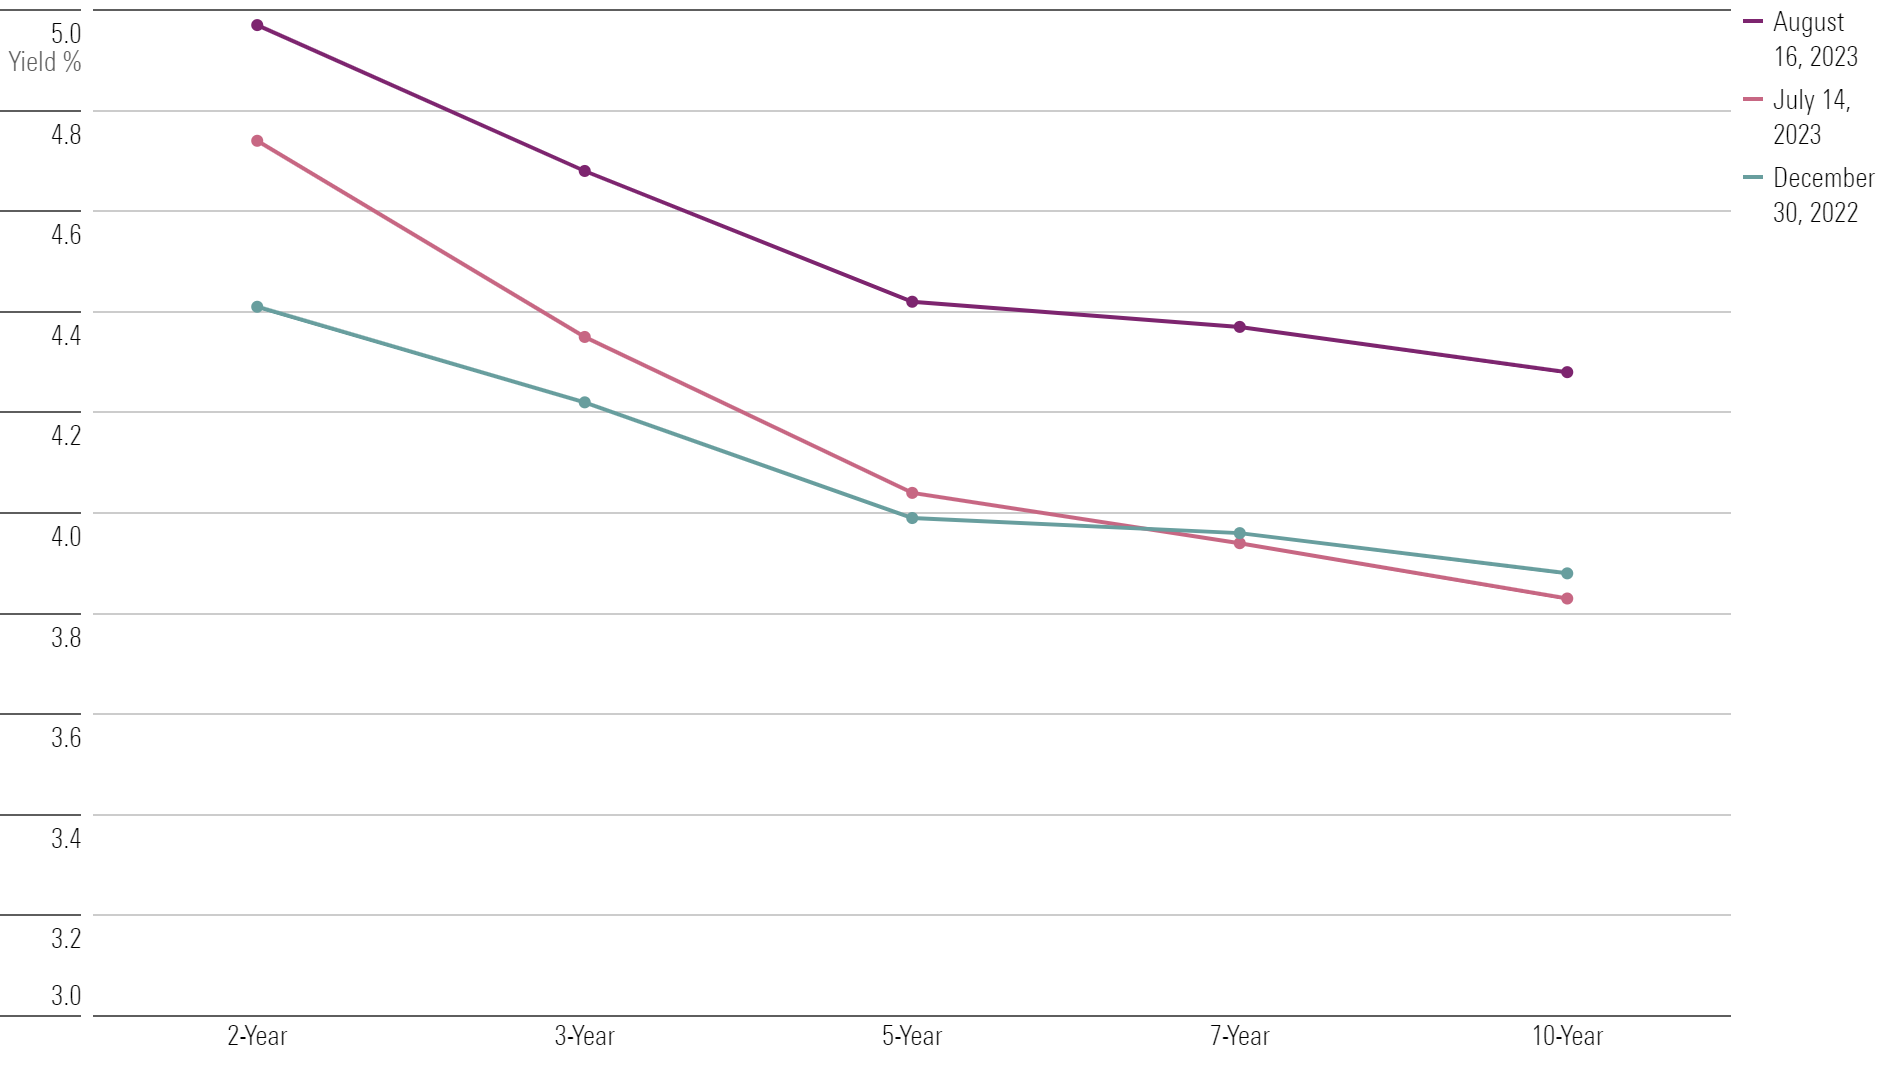
The US Treasury yield curve is essentially a way to depict yields across the maturity of bonds issued by the US government, from short-term debt (Treasury bills) to long-term debt (30-year bonds). The most common way to look at the curve is to chart yields from Treasury two-year notes out to those on Treasury 10-year bonds.
The vast majority of the time, yields from longer maturities are higher than those of shorter-dated bonds, reflecting the greater risks of holding bonds for longer periods. In the case of government bonds, the primary concern is the corrosive impact inflation has on fixed payouts.
But under certain circumstances (such as what’s taking place right now), the shape of the curve is flipped, with short-term yields rising above long-term yields.
The message of an inverted yield curve is that while interest rates are high now, in the future the rate of economic growth and inflation will be slower, and so interest rates will then be lower. Historically, it has taken a recession to realise such a scenario.
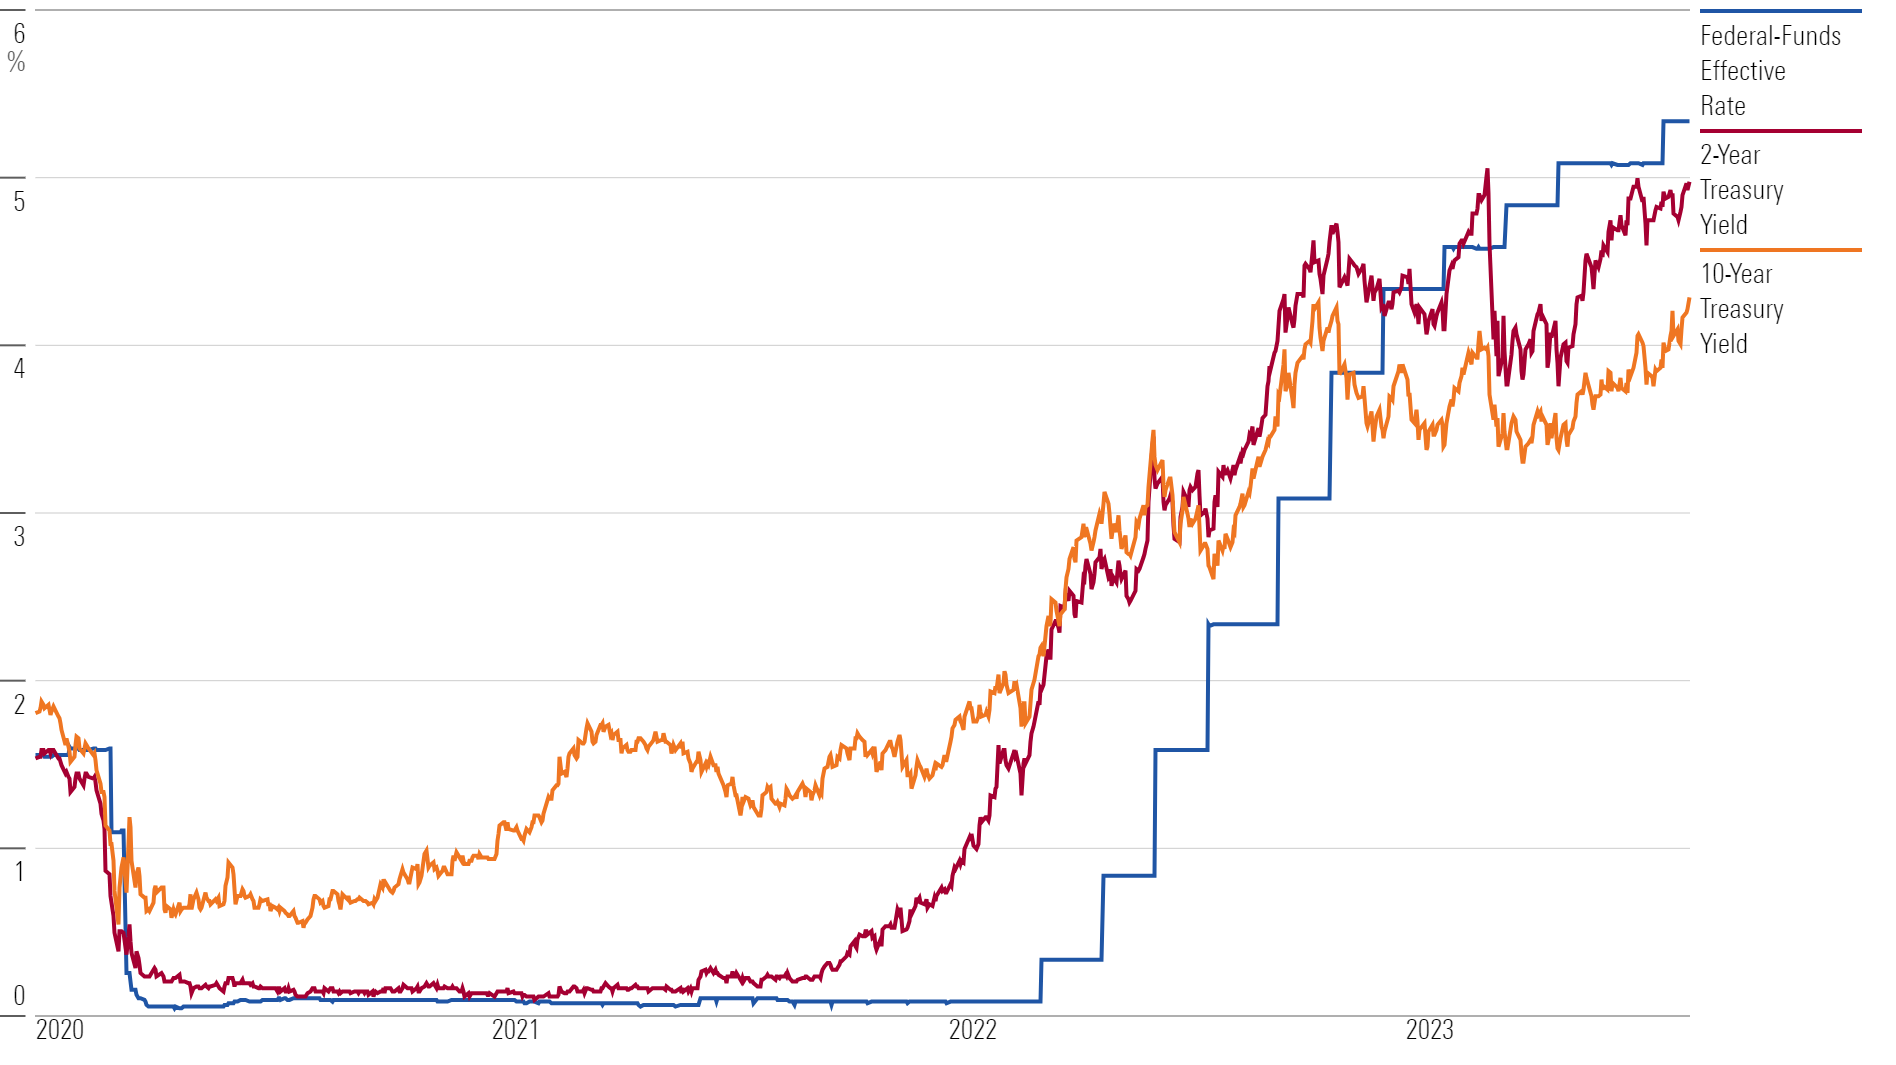
Last year, the Fed’s unprecedented series of interest-rate increases lifted short-term Treasury yields above long-term ones. As measured by the yield on the Treasury 2-year note versus the 10-year note, the yield curve first inverted during the current economic cycle in March 2022, and it has remained inverted since early July of that year.
Not only is the curve inverted, but the extent of the inversion is extreme by historical standards; it has been at its widest gap since the 1982 recession. Recently the yield on the Treasury 2-year note stood at 4.93% – 0.67 percentage points above the 4.26% yield on the 10-year note.
John Briggs, global head of economics and markets strategy at NatWest Markets, measures this current inversion as the longest-lived since the 1978-1980 period, which preceded the 1980 recession.
"The yield curve doesn’t traditionally live this negative for this long," says Mike Cudzil, portfolio manager at Pimco.
Why Inverted Yield Curves Matter
The yield curve is much more than just a chart; it has an economic impact.
Chief among them is that it creates a disincentive for banks to lend. A major source of profit for them is collecting deposits on which they pay short-term rates, then lending that money to borrowers, for which they charge long-term interest rates. If short-term rates are higher than long-term rates, that will generally make loans less profitable.
At the same time, even though the worst of the March regional banking crisis seems to have passed, the ripples are lingering as banks tighten lending standards.
"When banks are lending less, there is less money in the system, and the economy will eventually slow," says McAllister.
A second impact comes from the overall level of interest rates across the yield curve as measured both on a nominal basis and a so-called real basis, which compares them against the expected rate of inflation. For many years, real yields had been negative, meaning they were below the expected rate of inflation, which encouraged investors to put their money into riskier investments. But now, real yields "are as high as we’ve been for a long time," says Lindbloom.
Cudzil says Pimco’s base-case forecast is for a recession over the next few quarters. "We do see things slowing – we do see inflation slowing, and we do see growth slowing," he says.
"Whether it’s because of the yield curve, it’s hard to tease all that out. But it does seem that markets are saying monetary policy is in restrictive territory and will need to be eased."
Why Has the Yield Curve Been Wrong So Far?
Even as the yield curve has been negative for a sustained period, the economy has continued to chug along. Why the discrepancy?
For the most part, bond-watchers point to underlying forces keeping the economy rolling along, starting with the Fed’s aggressive efforts to pump money into it during the pandemic-driven recession. While the Fed has aggressively raised interest rates, a significant part of the effort was moving monetary policy out of an extremely accommodative stance.
"You have to look at the starting point of where we were," McAllister says. "We were at zero [percent federal-funds rate] for a fairly extended period of time."
In addition, the Fed was pumping money into the economy in a direct fashion by purchasing bonds – a practice known as quantitative easing.
"It was like we went to the wildest, craziest party any of us has ever been to, and they are gradually taking the punchbowl away," McAllister says.
Then there were the massive amounts of fiscal stimulus (nearly $5 trillion in total) as the government stepped in to help the economy weather the pandemic shutdowns.
"With Covid-19, you had this massive fiscal stimulus, and it went to every segment of the economy. It went to households, it went to businesses, went to non-profits, it went to state and local governments‚" McAllister explains.
"While we’re clearly in the later stages of that, it’s taken a long time for all of those entities to work through that excess cash."
Economists say that combination of stimulative fiscal and monetary policy has been a key driver sustaining strength in consumer spending and the job market, both of which have been important factors in the solid pace of economic growth.
"It was extremely easy monetary policy, unprecedented fiscal policy," McAllister says.
"It’s going to take longer to have the kind of impact that a 525-basis-point increase by the Fed would have and an inverted curve would have on the economy."
Market summary for the trading week ended August 18:
• The Morningstar US Market Index fell 2.19%;
• All 11 stock sectors were down for the week, with consumer cyclical and real estate as the worst performers. Consumer cyclicals were down 4%, while real estate stocks fell 3.4%;
• Yields on 10-year US Treasuries increased to 4.25% from 4.17%;
• West Texas Intermediate crude prices fell 2.33% to $81.25 per barrel;
• Of the 858 US-listed companies covered by Morningstar, 94, or 11%, were up, and 764, or 89%, were down.
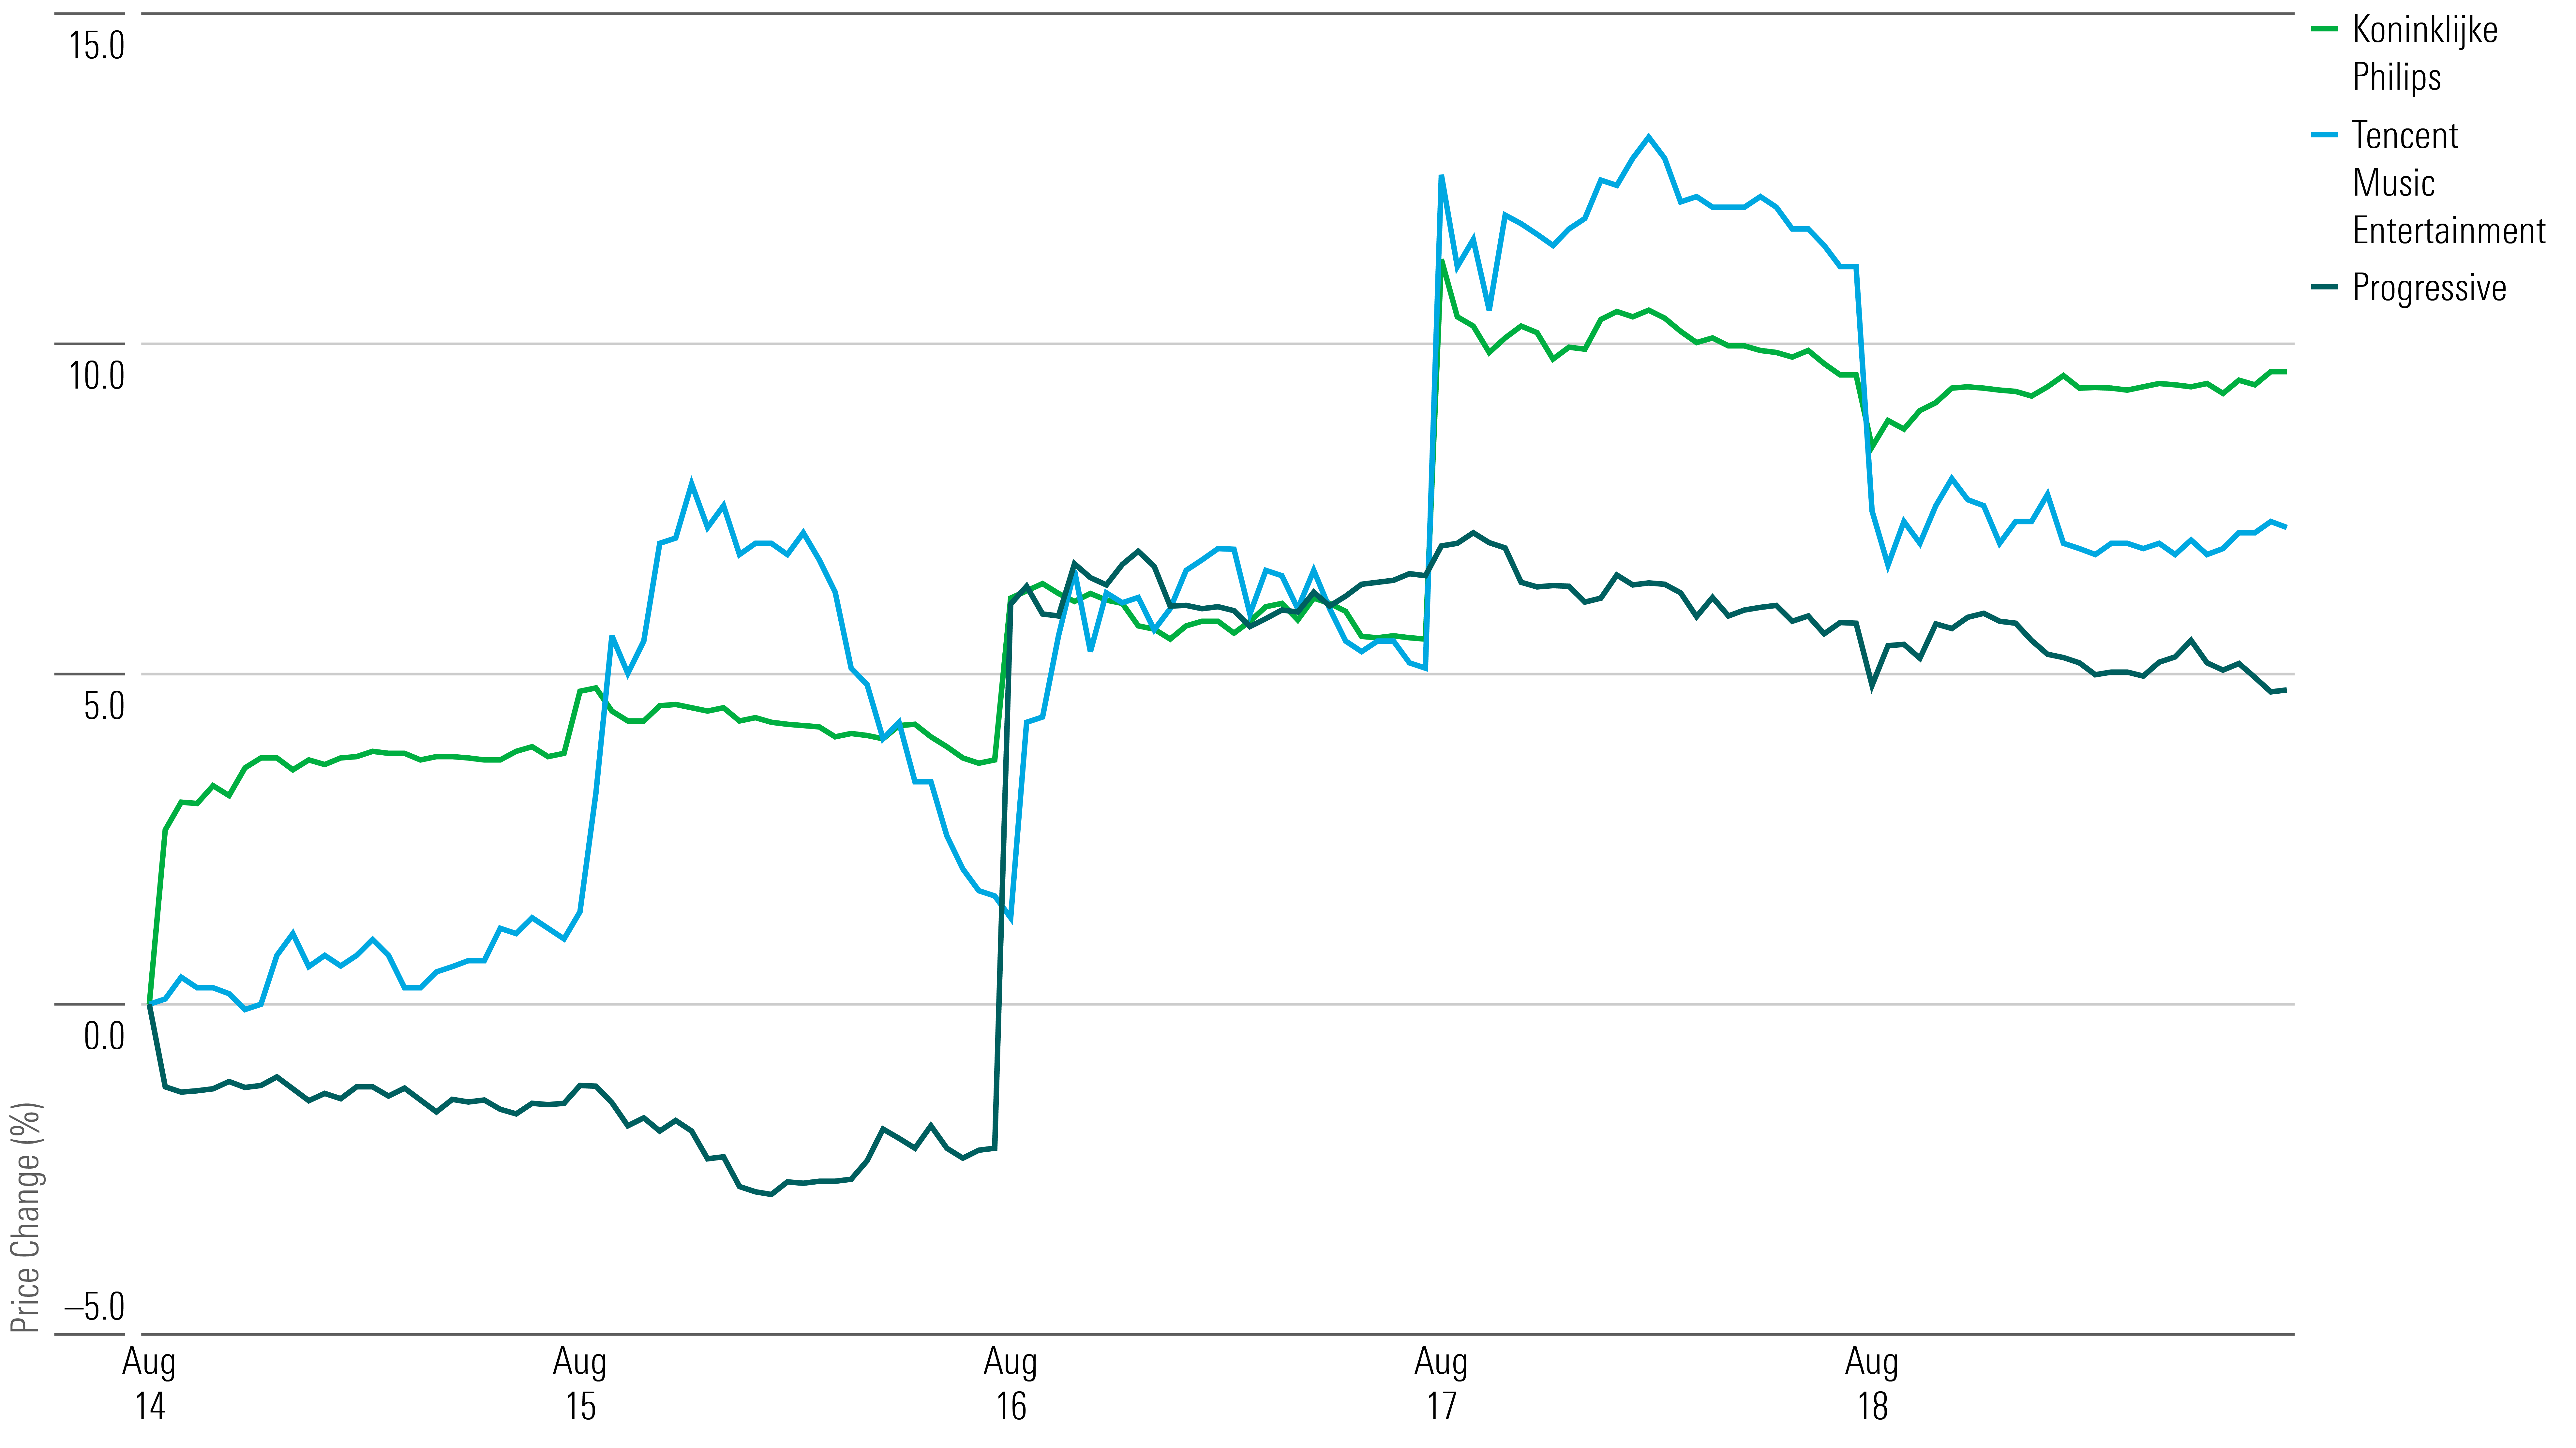
What Stocks Are Up?
Koninklijke Philips [PHG] stock jumped after Exor [EXXRF] bought a 15% stake in the medical device manufacturer for about $2.8 billion. The agreement between the two Netherlands-based companies allows Exor, which also maintains investments in firms that include Stellantis [STLA] and Ferrari [RACE], to raise its stake to at most 20%.
"Exor’s investment in Philips, their long-term outlook, and increased focus on healthcare and technology fit well with our strategy and substantial value creation potential," Philips CEO Roy Jakobs says.
Tencent Music Entertainment [TME] posted second-quarter results that fell in line with Morningstar senior equity analyst Ivan Su’s expectations, pushing its stock up. Revenue for the China-based music streaming services company grew 6% year over year, which was helped by a 37% increase in subscription revenue. Although it lowered guidance for livestreaming revenue, management still hopes for a margin expansion for the rest of the year, Su says.
Shares for Progressive [PGR] rose after the insurance provider announced it wrote close to $6 billion in premiums in July, up 21% from the same month last year. Additionally, the firm shared that it earned $5.6 billion in premiums last month, up 20% year over year, while its combined ratio increased to 90.6% from 89.8%. With shares rising above 8% on Aug. 16, Progressive marked its largest intraday percentage increase since March 2020.
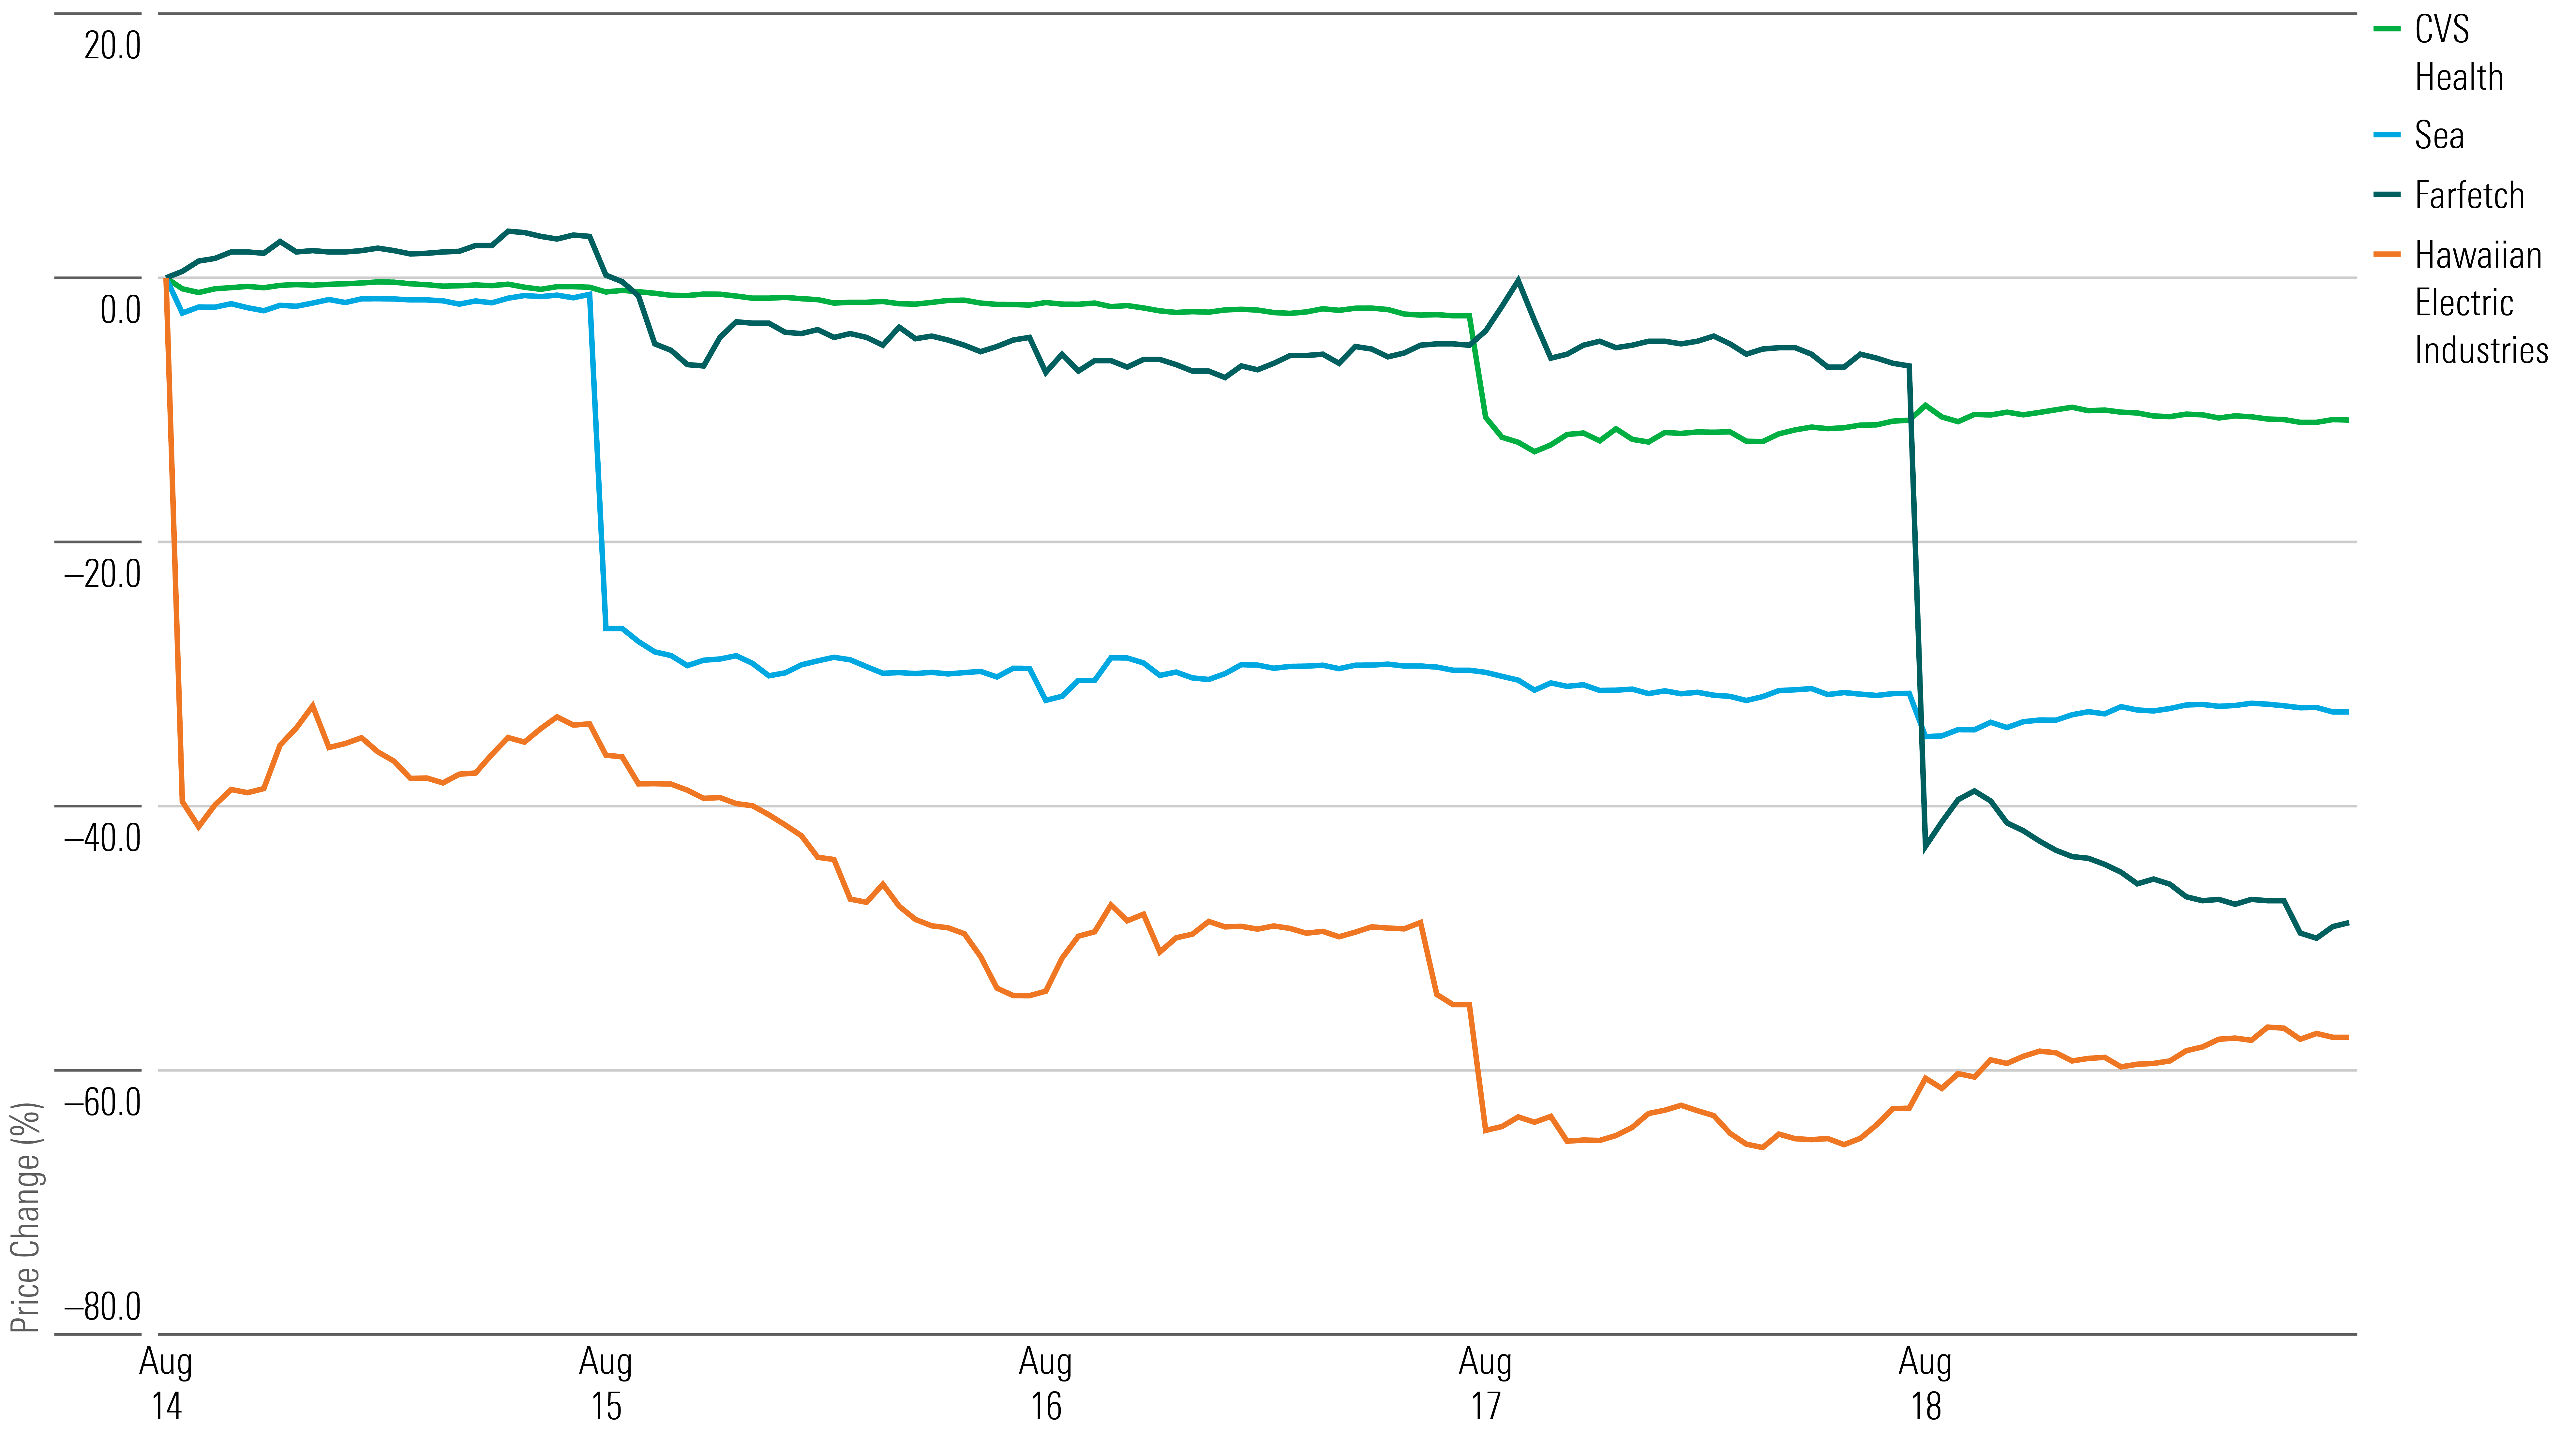
What Stocks Are Down?
Hawaiian Electric Industries [HE] stock plunged as shareholders assess the utility company’s potential liabilities regarding the deadly wildfires in Maui. Damages are estimated at $5.5 billion for the town of Lahaina, which saw the largest fire.
Morningstar strategist Andrew Bischof [warns] investors of the extreme uncertainty of the stock after residents filed a class-action lawsuit against the electricity provider for not shutting off power before strong winds. As outlets like The Wall Street Journal explain wildfires can occur when wind blows down power-carrying structures or a flying object hits power lines, resulting in big flashes of electricity. “Plaintiffs will need to show that the utility was negligent or could have reasonably prevented a loss,” Bischof says.
Shares for Farfetch [FTCH] ended the week down after second-quarter results showed declines in growth. The internet retailer’s gross merchandise value declined in the United States and China, both areas being the company’s main markets. Additionally, revenue for the subsidiary New Guards Group declined 42% in the quarter, while the firm’s wholesale-focused brands showed more weakness.
Sea SE stock sank after the company posted lower-than-expected results for its second quarter. The Singapore-based internet retailer generated $3.1 billion in revenue, which is 10% lower than forecasts from FactSet and Morningstar senior equity analyst Kai Wang. “Not only did Sea miss revenue estimates, but concerns over profitability resurfaced as the company indicated there could be periods of operating losses as it begins to focus on growth again,” Wang says.
Shares for CVS Health [CVS] declined after Blue Shield of California announced it will drop CVS subsidiary Caremark as its pharmacy insurance manager. The healthcare plan provider will instead partner with several firms, including Amazon.com’s [AMZN] pharmacy subsidiary and entrepreneur Mark Cuban’s Cost Plus Drug Company.
The contract deal may signal a change in the competitive field of pharmacy benefit management service companies. "CVS' dominance of the PBM business looks likely to decline materially in the near future with this and the other contract losses, which creates another hurdle to its double-digit earnings growth ambitions," Morningstar senior equity analyst Julie Utterback says.


:quality(80)/cloudfront-us-east-1.images.arcpublishing.com/morningstar/347BSP2KJNBCLKVD7DGXSFLDLU.jpg)