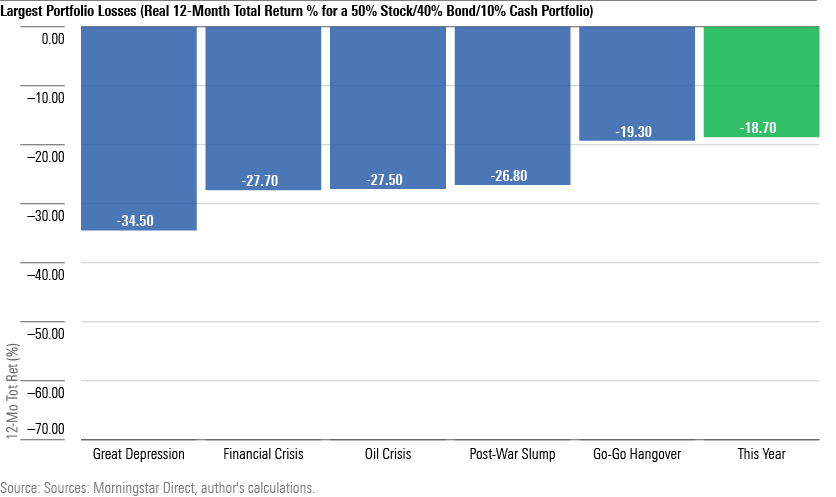
In the grand scheme of things, balanced portfolios have not performed terribly in recent months. The chart below shows the worst 12-month returns since 1926, adjusting for the effects of inflation, for a US-based portfolio consisting of 50% stocks, 40% intermediate-term government notes, and 10% cash. (For simplicity’s sake, I have included only the steepest loss posted during each bear market.)
Although the returns have by no means been pleasant, performance overall rates merely as bad, not historically awful. Not only was the Great Depression’s largest loss nearly twice the size of today’s decline, but three other periods also posted significantly greater decreases: 1) the 2009 global financial crisis, 2) the 1973-74 oil crisis, and 3) the post-World War II funk. Also somewhat worse than this year was the headache following the "go-go" years of the 1960s.
(Worth noting is the absence of a chronological pattern. In order of magnitude, the six selloffs occurred during the 1930s, the 2000s, the 1970s, the 1940s, the 1960s, and the 2020s. We can perhaps consider the Great Depression an anomaly that will not be repeated. Since then, though, there’s no hint that bear markets have become either less frequent or less severe with time.)
Saved by Stocks
The relative blessing for this year’s market has been equities. For the most part, balanced portfolios head where their stocks lead them. (This insight informs the strategy for risk-parity funds, which have sorely disappointed their investors in 2022. But that is a tale for another column.) In recent months, growth stocks have struggled mightily, but value stocks have remained steadfast.
As shown below, their support has made 2022 look fairly good from an equity-only perspective. (The exercise is conducted as before, by seeking the lowest real 12-month returns, but this time it is calculated solely from the performance of US stocks.)
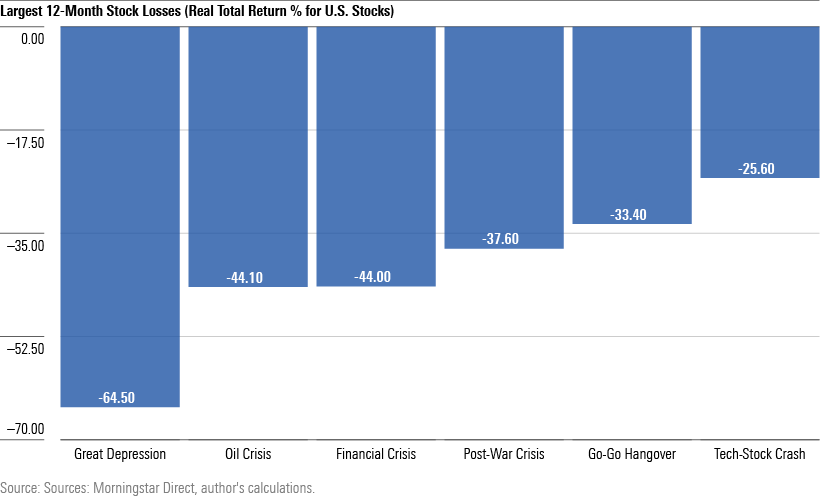
At negative 21.6%, the recent stock market drop fails to make the bottom six.
Bad News Bonds
Regrettedly, the same cannot be said for bonds.
Among fixed-income securities, there has been no refuge. Interest rates have spiked across the yield curve, thereby sinking all investment-grade debt. Lower-quality notes have also struggled. Sometimes when interest rates rise, junk bonds perform well, because credit spreads tighten. Not this year. Instead, credit spreads have widened owing to fears of a recession. The result has been comprehensive bond market losses.
The next exhibit demonstrates the point. It is calculated in the same fashion, and over the same period, as the previous two charts. That is, it presents the worst trailing 12-month results since 1926, including the effects of inflation. In this instance, though, the illustration depicts intermediate-term US government notes, rather than either balanced portfolios or the domestic stock market.
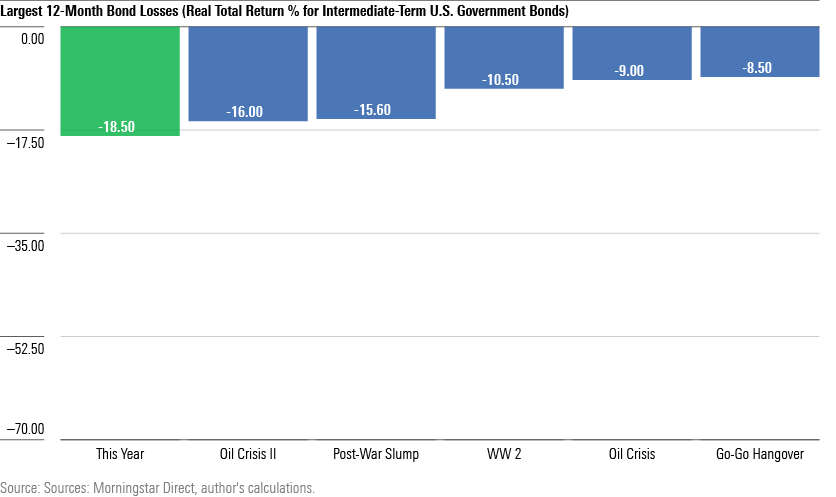
Two items from this chart stand out.
First, the bars are much shorter. True, the bond market’s fringes can be volatile. For example, long Treasury bonds dropped 34% in real terms from November 2021 through October 2022. That almost matches the lowest real return from a balanced fund during the Great Depression! But mainstream fixed-income securities, of the type held within an intermediate-term government index or big taxable bond funds, are usually quite stable.
Second, the current bond market rates as the past century’s worst. Barring substantial further losses, the stock market’s decline will soon be forgotten, buried in a database for future internet columnists to disinter. But the bond market’s downturn will long be remembered. The after-inflation loss for intermediate-term government bonds has been even greater than during the second oil crisis that ran from 1979 through 1981, when 10-year Treasury yields peaked at 15.8%.
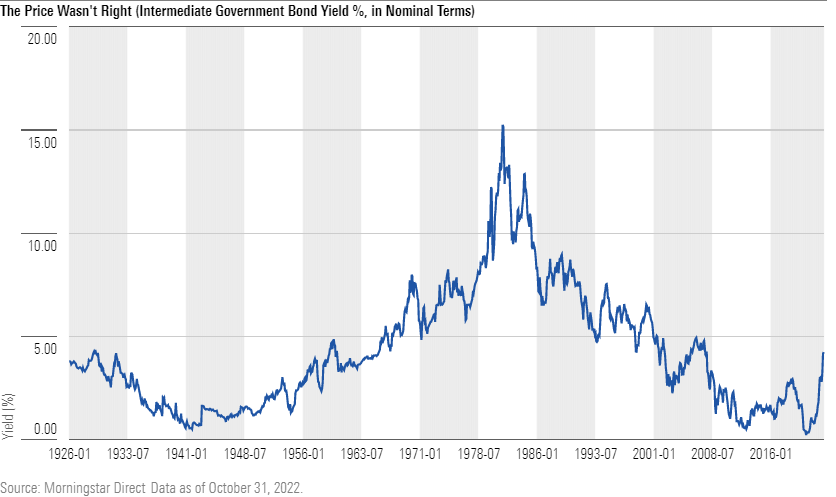
An Imperfect Storm
That is because US bond yields were at their very lowest when this bear market started. Save for a brief stretch in 2013, and again when the coronavirus pandemic arrived in spring 2020, Treasury payouts have not been below their summer 2021 levels for at least the past 150 years. Since bond yields are inversely related to price, Treasuries were at their most expensive when inflation began to resurface. A more dangerous combination for bond prices can scarcely be imagined.
Fund investors (and perhaps also pension fund managers, although the data to conduct that analysis is lacking) ended up buying high and selling low. In 2021, taxable-bond funds recorded their highest ever sales, receiving $340 billion of net new assets. This year, by a not-so-amusing coincidence, they have suffered the same dollar amount of net redemptions. Investors walked through the door when Treasury payouts were 1% and exited when they reached 4%. Buy high, sell low.
Conclusion
In 2010, the financial press printed story after story about the great bond bubble. Those predictions turned out to be, as Mark Twain famously stated about the reports of his death, premature. Although bond yields did rise shortly after those articles were published, they soon settled back down. Ten years later, the yield on intermediate-term Treasury notes had dropped below 2010 levels. The great bond bubble was no such thing.
However, if the timing of the warnings was misplaced, the sentiment was not. Buying securities when their prices are unusually high, in the belief they will grow higher yet, can be a profitable strategy. It was for buyers of Japanese stocks in the mid-1980s, internet-stock enthusiasts in the late 1990s, and Treasury investors a decade ago. But, as recent events have demonstrated, such a strategy is nothing if not dangerous.
John Rekenthaler is vice president of research for Morningstar


.jpg)
 Should Pension Funds 'Invest' in Crypto?
 Five Signs Your Investment is Actually Speculation
 Newly Undervalued Stocks for the Month
 Disinflation, Rates, and Recession: What Next for Europe?
 Are FTSE Mining Companies Cheap Right Now?
 Advice for George Osborne and Stock Market Regrets
 How to Find Solid Dividend-Paying Stocks
 10 Top-Performing Funds in the UK
 Fund Research: Europe’s Shining Stars
 China: Investors Unimpressed by Housing Measures, but Path to Recovery Intact
 Which AI Stocks Are Leading US Markets to New Highs?
 UK Equity Markets Are More Concentrated Than You Think
 10 Funds Underperforming their Peers in 2024 so Far


