Even as stock investors cheer signs of inflation peaking, the bond market’s best-known predictor of recessions is showing its clearest signal yet that there is trouble ahead for the US economy.
It’s known in Wall Street lingo as an inverted yield curve, and in recent days it has moved to its most extreme levels since the 1982 recession thanks to a big drop in long-term bond yields. When this dynamic has been in place over the last two decades, in each case a recession has followed. (For a look at the history of yield curves and recessions, see our earlier story here.)
While an inverted US Treasury yield curve isn’t known as a predictor of how deep or how long a recession may last, or even when a recession will begin, market watchers say the current message is unmistakable.
"Historically, when you get a sustained inversion like this […] it’s a very reliable indicator of a recession coming," says Duane McAllister, a senior portfolio manager at US firm Baird Advisors.
That leaves many market observers saying the real question isn’t whether there will there be a recession, but what it will look like. Will it be shallow or deep? Short or drawn out?
Money managers and economists are wrestling with these questions. Many say the outlook is highly uncertain against a backdrop of recent economic data painting a somewhat conflicting picture. On the one hand, inflation has started to come down from 40-year highs, which should give the Federal Reserve the ability to slow the pace of interest-rate increases.
However, inflation remains extremely hot despite its recent easing. At the same time, job growth and consumer spending remain robust. In fact, the Atlanta Fed’s GDPNow forecast, a running estimate of economic growth, is clocking in an extremely strong 4.2% rate of growth for the fourth quarter. Those indicators suggest the Fed can’t afford to stop raising rates too early and risk embedding higher inflation into the economy, analysts say.
What is a Treasury Yield-Curve Inversion?
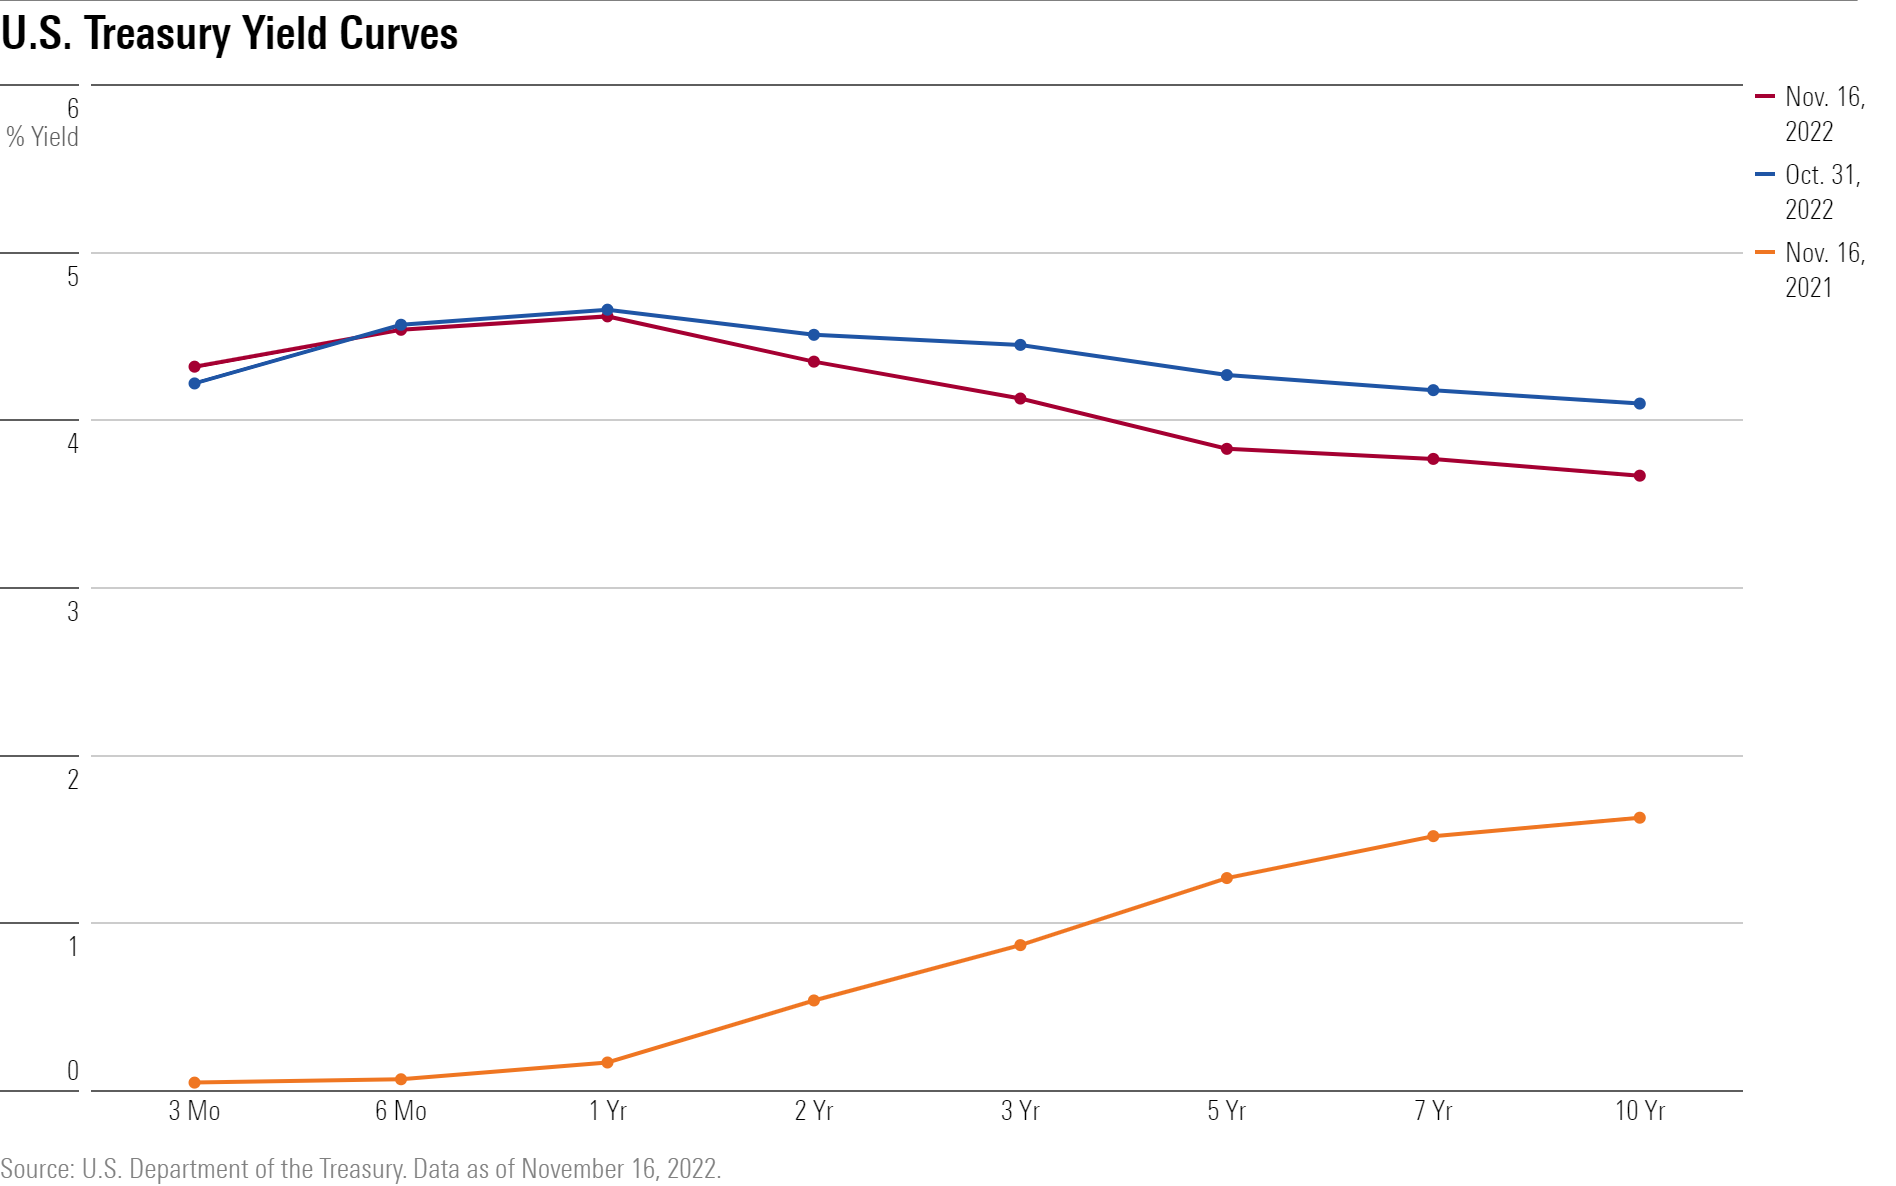
The US Treasury yield curve is essentially a visual way to depict yields on the range of bonds issued by the US government, from Treasury bills to 30-year bonds. The most common way to look at the yield curve is to chart yields from US Treasury two-year notes out to yields on US Treasury 10-year bonds.
Most of the time, yields on longer maturities are higher than yields on shorter-dated bonds, which reflects the greater risks of holding bonds for longer periods of time.
Under certain circumstances, such as those taking place right now, the shape of the yield curve can flip with short-term yields rising above long-term yields. That’s known as an inverted yield curve.
This year, the combination of Federal Reserve increases in the federal-funds target rate and expectations for continued rate hikes has lifted short-term US Treasury yields above that of long-term rates. (The fed-funds rate is the interest rate for overnight lending between banks.) The Fed has been aggressively raising interest rates with the aim of slowing the economy in order to take inflation from 40-year highs north of 8% down to a target of 2%.
The message from an inverted yield curve is that while interest rates are high at the present time, in the future, economic growth will be slower and inflation lower. That historically has generally taken a recession to be the case.
How Inverted is the Yield Curve?
Since early July, yields on US Treasury two-year notes have been above that of the 10-year note, and over the course of the summer and into the fall the gap has been widening. At the end of October, the US Treasury two-year note was yielding 4.51% , up from 0.73% at the end of 2021. Meanwhile, the U.S. Treasury 10-year note was at 4.10%, up from 1.52% on Dec. 31.
Jan Nevruzi, US rates strategist at NatWest Markets, says a key reason that long-term interest rates have been able to come down is that investors believe that the Fed will succeed in reducing inflation. "Inflation expectations are still fairly anchored," he says.
This trend was turbocharged following the October Consumer Price Index and Producer Price Index reports, which appear to have confirmed that inflation has peaked and beginning to trend lower. That prompted a jump in bond prices—and decline in yields—with dramatic moves among intermediate-term and longer-term bonds. The yield on the 10-year note fell to 3.67% as of 16 November, while the yield on the two-year note fell to 4.35%.
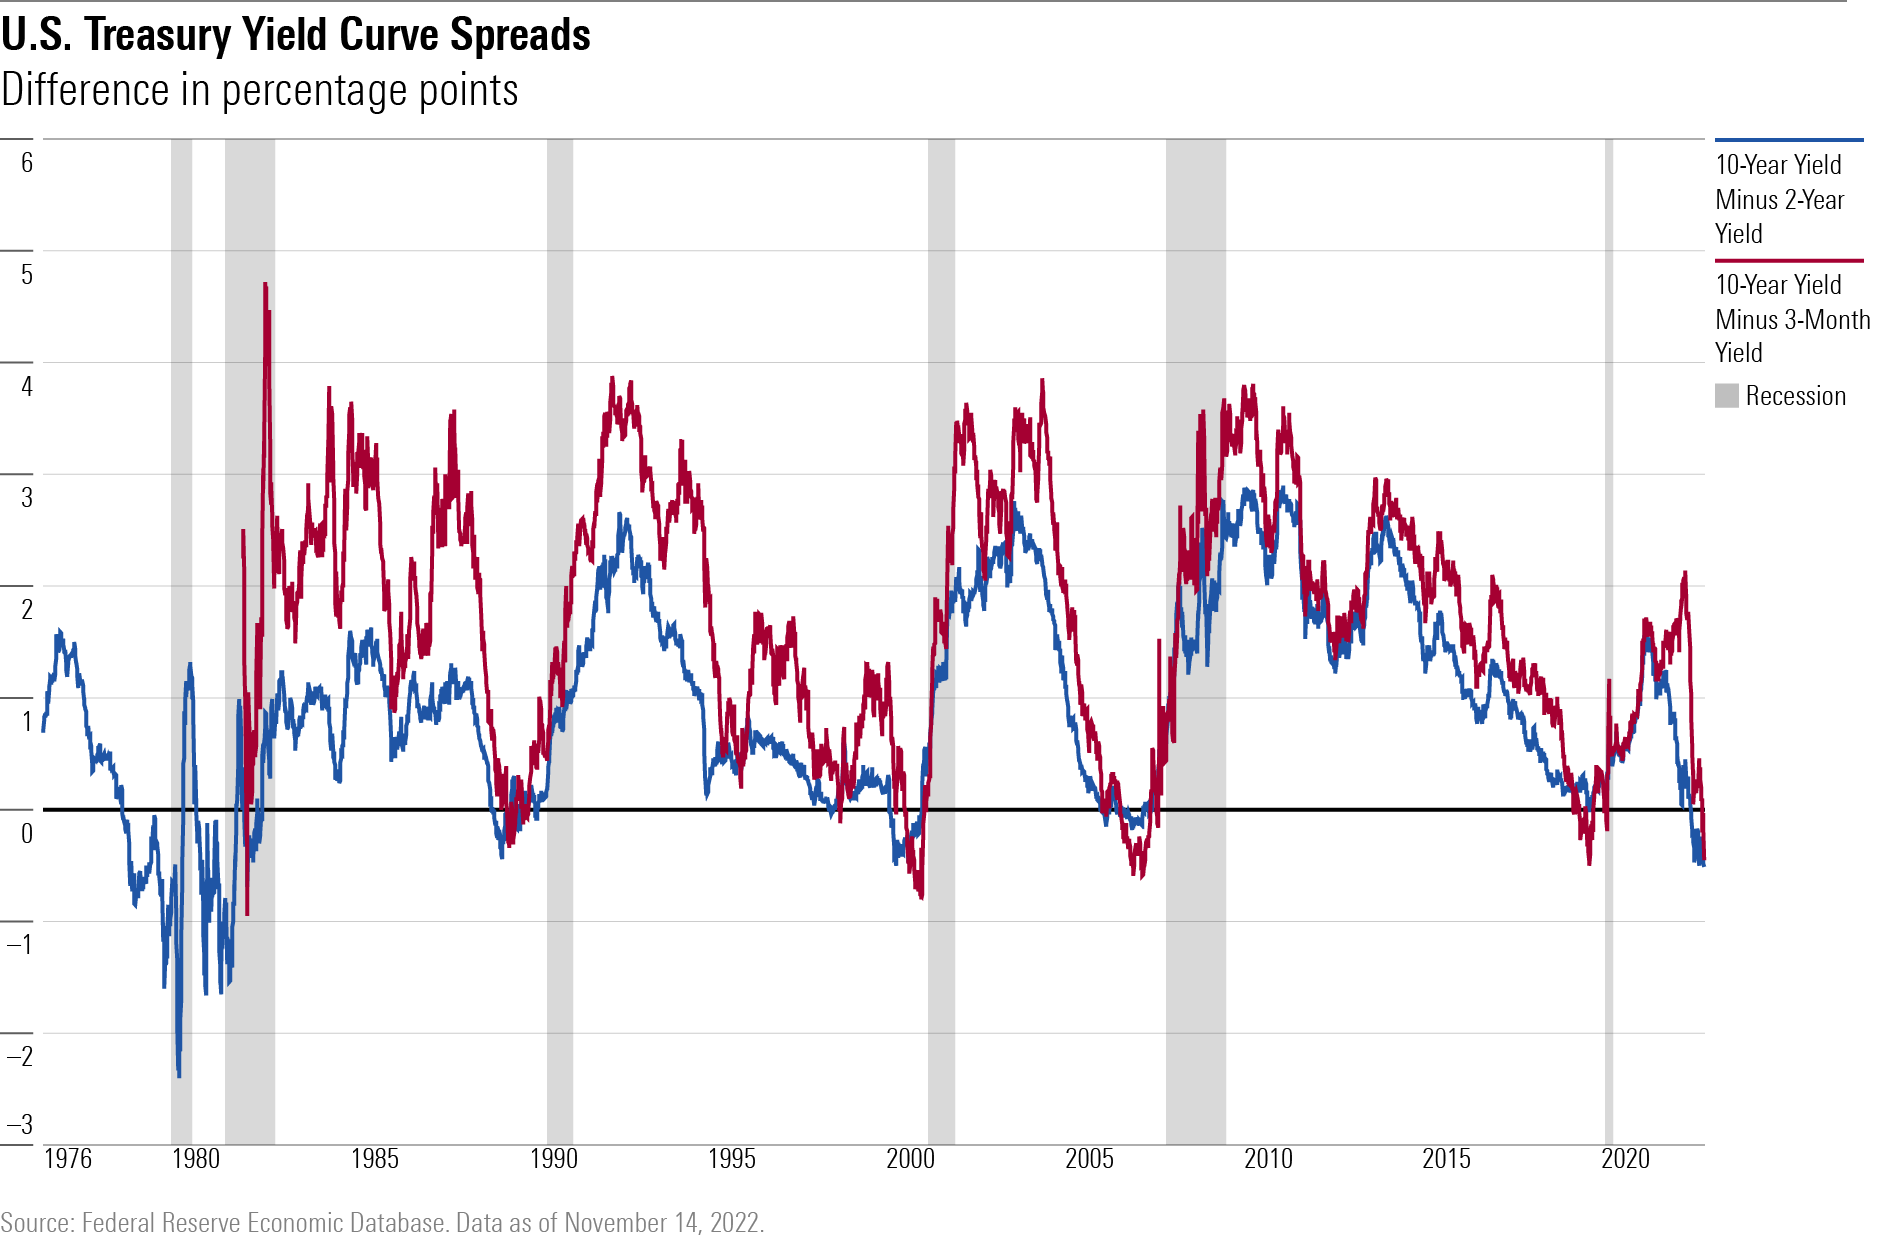
The faster decline in yields among long-term bond yields than on short-term bonds meant that the gap between two-year notes and 10-year notes has widened out to -0.68 percentage points. The last time the curve was this inverted was in October 1982, a time when the US economy was in the middle of a roughly yearlong economic downturn.
On another yield-curve measure, comparing yields on the US Treasury three-month bills to 10-year notes, the yield curve is inverted by 65 basis points, the greatest inversion for this measure since just before the 2001 recession.
"The market started to have a little bit of disinflation euphoria," says Alexandra Wilson-Elizondo, head of multi-asset retail investing at Goldman Sachs Asset Management, adding that she believes that markets are now underestimating how long the tightening cycle by the Fed will continue.
How Bad Would a Recession Be?
Given the warning signs, and months of discussions in the markets about the potential for recession—which is generally defined as two consecutive quarters of negative economic growth—should one occur, there is little reason for investors to be surprised.
"This will be the most anticipated recession in history," says John Linehan, portfolio manager of the US large-cap equity income strategy and chief investment officer at T. Rowe Price.
Preston Caldwell, chief US economist at Morningstar, meanwhile, says it’s still a coin flip in terms of whether the economy will end up in an official recession. But, more importantly, he says, "we’ve consistently argued that the binary question 'will there be a recession?' misses the point; any recession should be relatively mild and short-lived, in our view."
Baird’s McAllister says the economy's fundamentals mean a downturn shouldn't be too deep. "You’ve got households in pretty good shape," he says. "People aren’t over-levered and even if home values come down, there’s a lot of equity there." In addition, corporate balance sheets are healthy and at the state and local government level, finances generally "have never looked better, with strong tax revenues […] and reserves at record highs," he says.
At Goldman Sachs, Wilson-Elizondo says the jury is still out when it comes to the kind of landing the economy experiences as a result of the Fed’s aggressive interest-rate increases. "There are some real wild cards that haven’t been resolved," she says.
One is the impact of the Fed unwinding its massive holdings of bond purchases made during the Covid-19 recession in order to pump money into the financial system and support the economy. (This effort by the Fed is commonly known as quantitative tightening.)
The second is the pace of China’s economic reopening from its strict "zero-Covid-19" policies, which, depending on the pace and timing, could give a boost to the global economy and also elevate commodity inflation.
Within the US economy, Wilson-Elizondo says they are focusing on three variables in the job market to help get a sense for whether there will be a hard landing or a soft landing: the ratio of job openings to job seekers, the participation rate of workers in the job market, and the overall pace of job creation.
How Much Will Inflation Come Down?
When it comes to the outlook for inflation, the focus in the markets in recent weeks has been on the direction that inflation rates have been taking: lower. But Wilson-Elizondo says what matters more is where the actual inflation rate ends up. As of October, the CPI posted a 7.7% annual increase.
"We’re very focused on the outright level more so than on the path," she says.
"But in terms of the path, the speed at which (inflation comes down) is very critical." For now, she says, what appears clear is that it is hard to see inflation coming down to the Fed’s 2% target rate anytime soon, and, "we think they are going to have to stay restrictive."
At NatWest, Nevruzi says they are looking for a recession that begins by the end of this year, led by declining consumer spending, "but nothing like a collapse where you see activity to coming a halt.” Instead, he says, “We see the economy tipping into a recession, more of a gradual slide, and gradually coming back up into 2024."
Against this backdrop, NatWest expects a gradual decline in inflation in 2023, but with the CPI staying at above a 4% annual rate through the middle of 2023 and only breaking just below 3% by year-end. Some of the slower-moving components such as rental costs or services prices such as airfares will help keep inflation on a "slow path," he says. "That’s why we think the Fed will hike to 5% (from its current target of 3.75%-4%) and stay at 5% until the end of the year," he adds.