As has recently been shown, short-term inflation estimates must be consumed with a mountain of salt.
Perhaps the secular trends are easier to spot. Many barometers are temporarily volatile but persistent over the long haul. Since 1990, for example, yearly real gross domestic product growth within the United States has spanned from a high of 5.7% to a low of negative 3.4%. But the 10-year annualised rates have landed in a much narrower range, almost always between 1.5% and 3.5%. Guess 2% for the next decade (as recent results have been somewhat lower), and you will likely place very near the truth.
No Tip from TIPS
It may be that 10-year inflation rates are similarly foreseeable. The most logical method for forecasting the next decade’s level of inflation is the “breakeven rate,” which subtracts the yield on 10-year Treasury Inflation-Protected Securities from the yield of 10-year Treasury notes. Because TIPS add the effect of inflation into their payments, that gap can be regarded as an estimate of future inflation.
Unfortunately, reliable data on the TIPS breakeven rate begins only in 2003. (The investment debuted in 1997, but its early values fluctuated sharply, as investors struggled to price the newfangled securities). That limits the potential evaluation period to a mere nine years, from 2003 through 2012—too short for drawing a useful verdict. Other approaches must instead be sought.
The Alternatives
Three methods deserve consideration. Each possesses a public track record that extends for several decades, thereby permitting a sufficiently long test.
1) 10-year Treasury yields. “The marketplace solution.” At least in theory, Treasury prices look forward, not backward, so that today’s payouts anticipate tomorrow’s inflation. Presumably, however, Treasuries also deliver a real gain—that is, return above the inflation rate. Therefore, in addition to evaluating a) untouched 10-year Treasury yields, I also assessed b) adjusted yields that removed the note’s after-inflation profit.
2) Trailing inflation. “The economic angle.” Rather than depend upon the collective views of the marketplace, as with 10-year Treasury yields, the signal of trailing 10-year inflation relies solely on a demonstrated fact. True, conditions change, so that inflation is higher during some eras than others, but that process takes time. The inflation rate for one decade may thus be a suitable guide for the next.
3) Cleveland Fed prediction. “The expert opinion.” Since 1982, the Cleveland Federal Reserve Bank has regularly published 10-year inflation forecasts, updated monthly.
The Results
The following chart plots the monthly difference between a) each of the four inflation predictors (counting both versions of the 10-year Treasury yield) and b) the next decade’s annualised inflation rate, as measured by the Consumer Price Index. The study runs from January 1982 through September 2012.
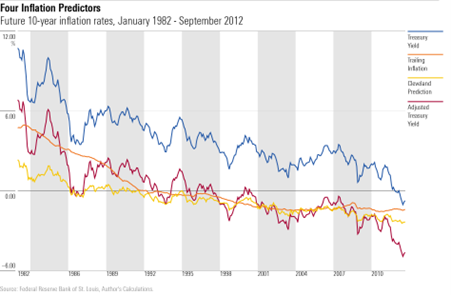
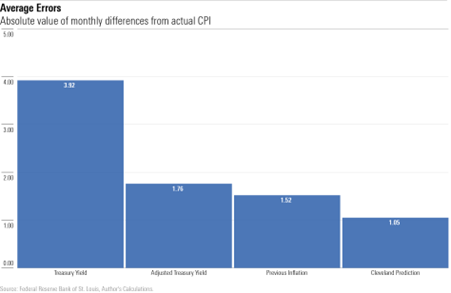
The weakest signal, by a wide margin, was untouched Treasury yields. That was appropriate; otherwise, Treasuries would have been unprofitable in real terms.
Next came the red line of the adjusted Treasury yields. That outcome surprised me; I would have expected the marketplace to be more accurate than the historic inflation rate. But investors strongly overestimated the strength of future inflation at the study’s beginning, then underestimated it at the end.
Best of all was the Cleveland Fed’s forecast, on account of its temperance. In January 1982, Cleveland’s officials defied the prevailing sentiment by estimating a relatively modest future inflation rate of 6.2%. That still exceeded the future rate, but by much less than the other predictions, as at the time 10-year Treasuries yielded 14.6% (!), while the previous decade’s inflation rate was 8.6%.
Here are the summary statistics for each approach.
Present Predictions
Let’s see what the three approaches (I jettisoned the fourth measure of the untouched Treasury yield) now testify. Given its superior track record, the forecast from the Cleveland Fed will carry the most weight, but if both the marketplace and past inflation strongly disagree with that team’s estimate, that counterevidence is worth considering. After all, while Cleveland’s declarations have been the best of the bunch, they have not been perfect.
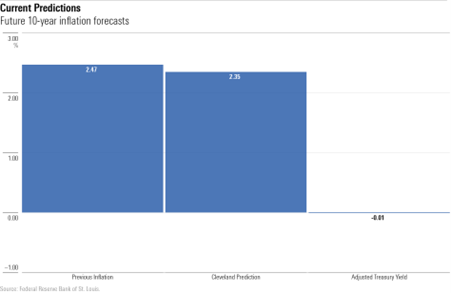
The projections certainly are heartening. Cleveland’s staffers are unimpressed by recent events. Meanwhile, trailing 10-year inflation remains low, as it remains relatively unaffected by the past year’s crease. And when adjusted to reflect their customary real interest rate, 10-year Treasury notes don’t expect inflation at all. Over the past 40 years, 10-year Treasuries have produced 3.89 annual percentage points of real return. At Friday’s close, their yield was virtually the same, at 3.88%.
To be sure, 3.89 was not the intended real return; Treasury notes delivered that amount by accident, courtesy of investors’ mistakes during the 1980s. An annual after-inflation profit of 1-2 percentage points would have sufficed. Even that figure, though, implies a low forecast of future inflation from 10-year Treasuries—somewhere quite near both the Cleveland Fed’s projection and the signal provided by the trailing 10-year inflation rate.
Conclusion
Even a 30-year horizon, as used in this column’s discussion, is distressingly short for evaluating the effectiveness of a decade-long indicator. After all, the data contain only three independent periods.
But between the fact that the Cleveland Fed’s previous predictions have been fairly accurate, and that the other two indicators closely match its signal, we can I think be reasonably confident that long-term inflation will be milder than many investors now believe.
This article was originally published on Morningstar.com


.jpg)
 Should Pension Funds 'Invest' in Crypto?
 Best and Worst Performing ETFs in July
 The US Economy is Cooling, and That's Good News
 ECB Rates Decision: What to Expect on July 18
 Are FTSE Mining Companies Cheap Right Now?
 Advice for George Osborne and Stock Market Regrets
 How to Find Solid Dividend-Paying Stocks
 10 Top-Performing Funds in the UK
 Fund Research: Europe’s Shining Stars
 NatWest Shares Up as Profits Beat Expectations
 After Earnings, Is Netflix Stock a Buy, a Sell, or Fairly Valued?
 Going into Earnings, is Apple Stock a Buy, Sell, or Hold?
 Unilever Earnings: Growth in a Challenging Market
 AstraZeneca Earnings: Steady Outlook but Growth Could Slow


