The market downturn caused by the Covid-19 pandemic was one of the most severe in recent history, but it also proved to be one of the fastest recoveries. This episode reinforces two important lessons for long-term investors:
1. Don’t panic and sell stocks when the market crashes.
2. It’s very hard to predict how long the stock market recovery will take.
During the downturn, I made these points in an article about the history of market crashes. I showed that the 150-year record of US market returns is littered with bear markets (downturns of 20% or more)—and in each case, the market eventually recovered and then went on to new heights.
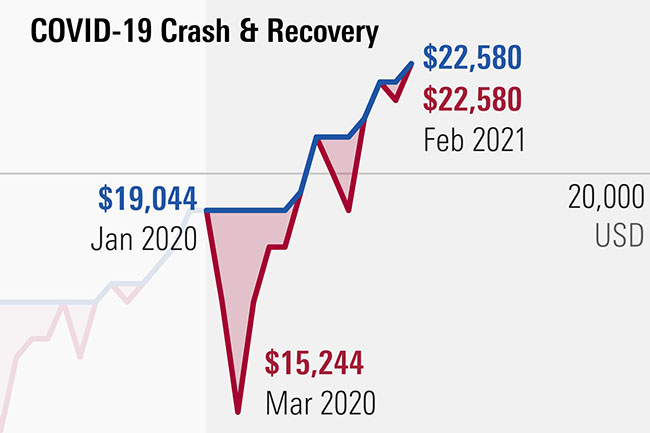
Indeed, this also proved to be the case in 2020. After a decline of 20% (in real terms) from December 2019 to March 2020, the US equity market fully recovered in just four months and was back to its precrash level by July, soon pushing higher. This market recovery is evidence of the second lesson: One can never predict how fast a recovery will be.
But the last year has also been a stark reminder that the stock market is not the economy. Though the market has recovered, the economy is still suffering due to the Covid-19 restrictions on economic activities. As of January 2021, the US employment rate was down 5.4% from pre-pandemic levels, particularly in consumer services like restaurants and hotels.
As the rate of vaccinations increases and herd immunity is eventually reached, the economy will open up and activities will resume. But no one can know how this will affect the stock market.
The Latest in a Long History of Market Crashes
To put the Covid-19 downturn and stock market recovery into context, I updated the chart that shows the history of market crashes. The chart, which is based on a series of returns I created to form a hypothetical US stock market index, displays US real inflation-adjusted equity returns going back to 1871.
In this exhibit, the red cumulative wealth line shows the growth of the $1 (starting in 1870), with dividends reinvested, in the stock market index. In blue is the peak-to-recovery line, which traces the growth of $1 until the start of a decline, and then stays at that same peak value until the market recovers to that level. The gap created, shaded in the chart, shows the depth and length of each decline.
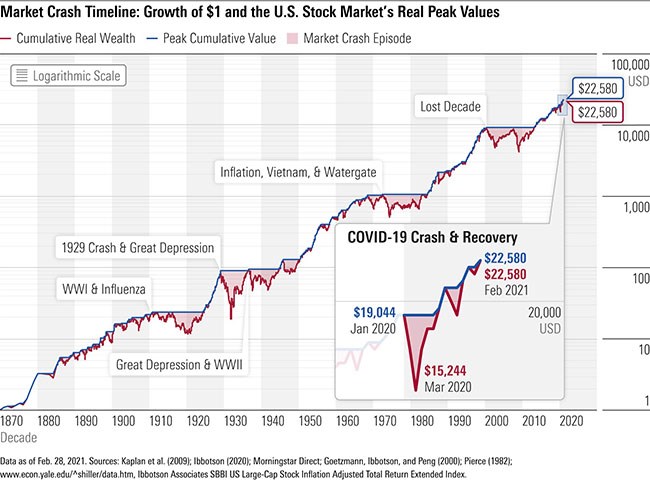
This exhibit illustrates two important aspects of US market return history:
1. Despite numerous severe drops, the cumulative wealth line shows that $1 grows to $22,580 over this period of 150 years. In other words, staying in the market and weathering the storms have paid off for investors. (However, this could be a case of survivorship bias.)
2. The range in shaded areas shows that some declines are worse than others—and how long each lasts is unpredictable.
Including the Covid-19 crash, there are a total of 18 bear markets over this period of 150 years, suggesting that on average they occur about once every eight years. The worst one was the Crash of 1929, along with the first part of the Great Depression, which saw a 79% loss. It took the market a little more than four years to recover from that trough. The second-worst drop is the 54% decline over the Lost Decade (the period from August 2000 to February 2009). The market index did not fully recover until May 2013, almost 12 and a half years after that decline began.
It can be helpful to consider the Covic-19 crash through the lens of these other bear markets. You can see in the magnified part of the chart that the downturn—while sudden and sharp—was a relatively minor blip in this larger picture of market gains and declines.
The history of market crashes is long—they’ve been occurring regularly since the late 19th century—and being able to recognize their regularity in the data can offer us a better understanding of the risks of equity investing.
Not all Market Crashes and Recoveries Feel the Same
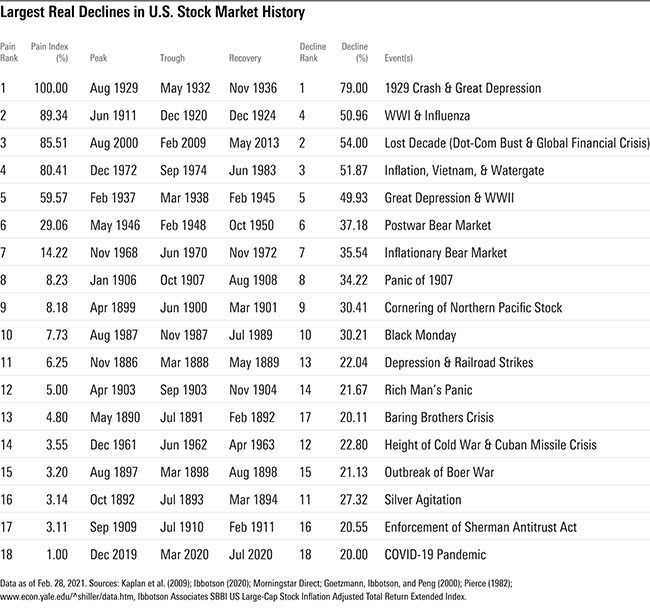
In last year’s article, I developed the “Pain Index” to measure how bad each episode of decline and eventual recovery was. There’s more detail on the methodology there, but essentially, the index compares each crash with the worst crash in the data, the Crash of 1929 and the beginning of the Great Depression. It accounts for both the magnitude of a crash and how long the decline and its subsequent recovery took.
Below, I have updated the table that sorts these market crashes by how painful they were so that it includes the Covid-19 crash.
You can see that in terms of its impact on the stock market, the Covid-19 crash was the least painful of the 18 crashes, due to its quick recovery. With a Pain Index of only 1%, it was a tiny fraction as severe as the major crashes of the time period.
Lessons Learned From the History of Market Crashes
At the time of the crash, of course, we couldn’t have known that would prove to be the case—which is why some investors panicked and sold off their stock holdings.
It just goes to show the unpredictability of markets. Not all crashes are alike in their severity and duration and naming the market’s peak or bottom is tough. Therefore, the best bet is to prepare now for the next crash by owning a well-diversified portfolio that fits one’s time horizon and risk tolerance.
What I wrote at this time last year rings truer than ever: “Market risk is about more than volatility. Market risk also includes the possibility of depressed markets and extreme events. These events can be frightening in the short term, but this analysis shows that for investors who can stay in the market for the long run, equity markets still continue to provide rewards for taking these risks.”