
The outbreak of the coronavirus sent global stock markets spiralling downwards, as panicked investors worried over the long-term implications of the epidemic on the global economy. But markets have quickly started to recover and for the first month this year, all the asset classes have delivered positive returns. Our monthly heat map of asset class performance is, for the first time, a sea of green.
It's a stark change from just two months ago; in March, only property and money market funds were in positive territory. A month, in April, we saw the start of a recovery, with just three asset classes - money market, property and commodities - shaded in red.
The chart below shows the returns of each asset class in May; the size of the box denotes the amount of assets under management in the category.
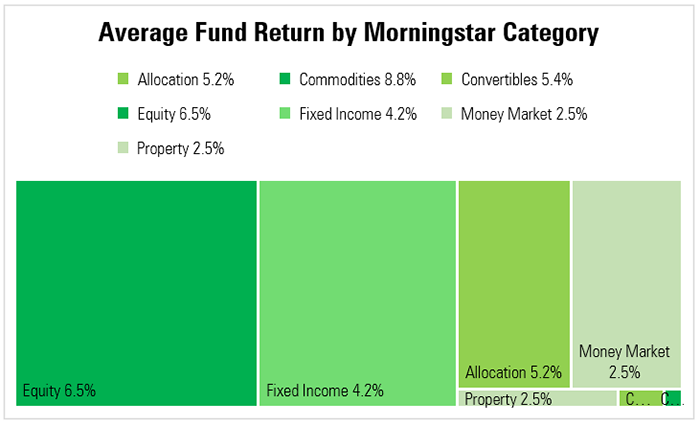
Commodity funds delivered the best return in May, up an average 8.8% in the month even despite the uncertain outlook for the group after the oil price went negative. It’s good remembering that commodities is also made of assets such as silver and gold, which are very popular in times of uncertainty.
The average equity fund, meanwhile, returned 6.5%, helping to draw investors back to the stock markets after many turned to safety in the sell-off. Risk-on investors certainly seem confident the market can bounce back; Morningstar data shows some £5 billion was poured into funds in the month, with the majority going into equity funds. In April the US stock markets saw one of its best months in many decades and this change in direction gave some investors the confidence to invest in risker assets.
Allocation funds produced an average return of 5.2%. These multi-asset funds are mostly composed of equities and bonds, and this diversification often makes them an attractive option at times of uncertainty. Meanwhile, convertibles and fixed income were up 5.4% and 4.2% respectively. Property funds and money market funds delivered an average return of 2.5%.
The Recovery Has Started
The below bar graph compares the performance of the average fund return in each asset class for May compared with the year to date. It shows how much ground many funds still have to make up after March's brutal sell-off.
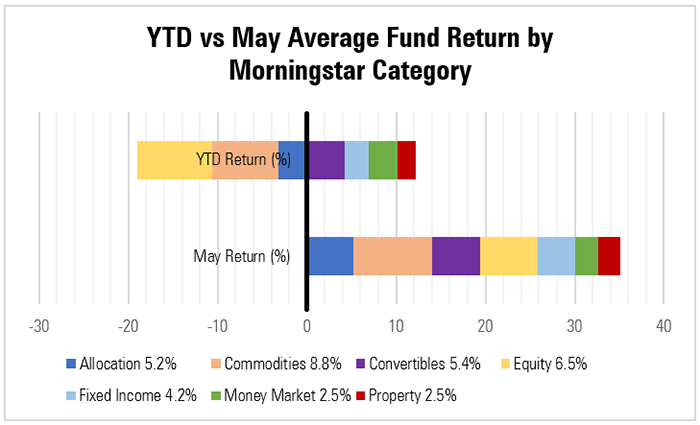
Despite strong returns in April and May, for example, equity funds are still down 8.4% year to date. Commodity and allocation funds find themselves in a similar position, returning -3.2% and -7.4% since the beginning of the year. While investors sentiment appears to have undergone a sharp turnaround, they may need to wait a while longer for their portfoios to recover from one of the worst stock markets crushes of the history.