History shows us that staying the course is often the best strategy during a stock market sell-off. Here are three charts that prove it:
Bull Runs Last Longer than Bear Markets
While a downturn on the stock market is never pleasant, we know they don’t last forever. In fact, bull markets typically last a lot longer than bear markets. Stock market shocks tend to be sharp and painful but usually short-lived.
The chart below shows the US stock market over the past 100 years. We can see that of all the sell-offs over the past century just one lasted more than two years. This was the Great Depression, which was then compounded by World War II. While the downturn lasted 34 months, the subsequent recovery period lasted a brutal 151 months in total. But the subsequent bull market, from the end of the war, lasted almost as long at 146 months.
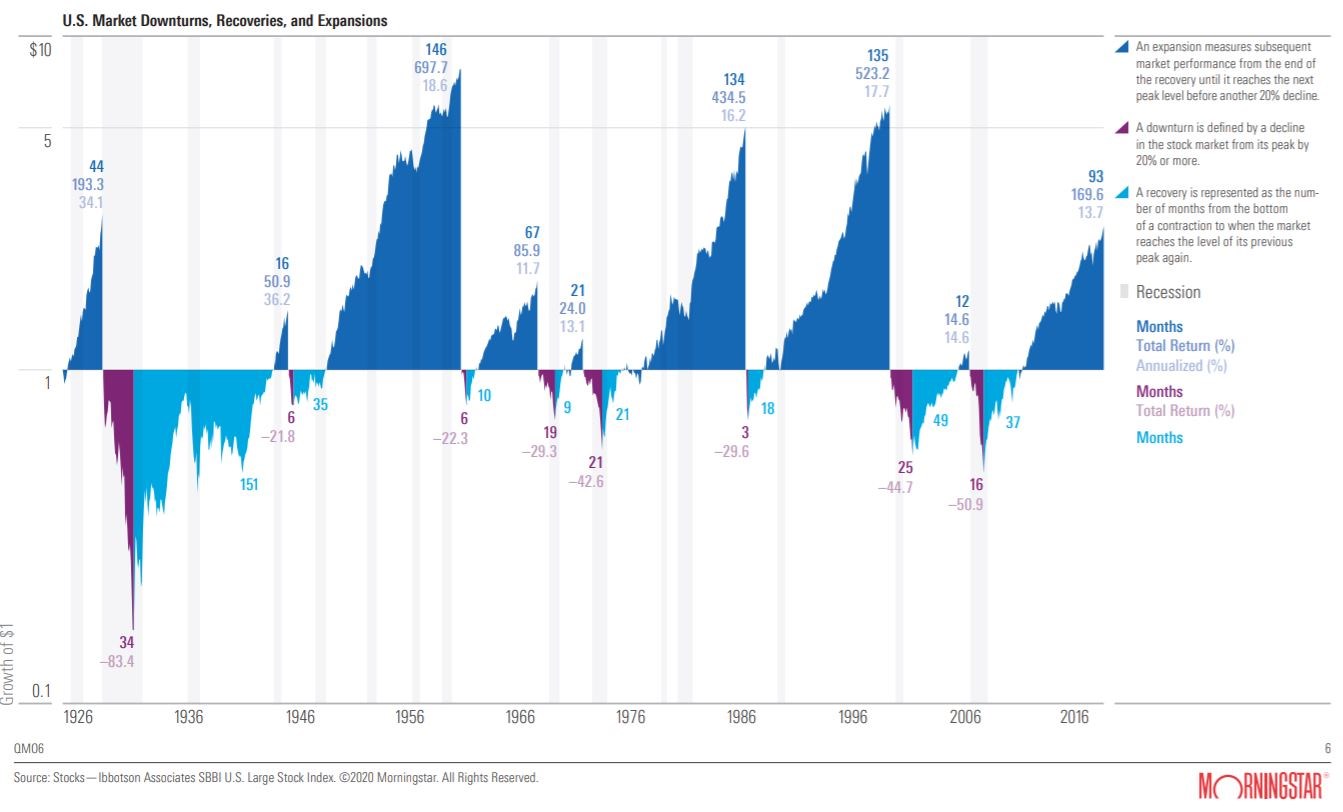 It’s worth pointing out, too, that while the downturn resulted in losses of 83.4% on the stock market, the subsequent recovery brought incredible returns of 697.7%. This is a crucial fact of investing: the most you can lose is 100% but the upside is unlimited. The most recent period of expansion lasted 93 months, bringing returns of 169.6%.
The Market Wins More than it Loses
When the value of your portfolio is falling, it can feel difficult to recall a time that investments weren’t plunging. But if you look at the performance of the stock market over the long-term, you’ll find it wins far more than it loses.
This chart looks at the performance of the Ibbotson Large Company Stock Index since 2019. We can see from the performance of each individual year of the index that it was only down overall in 27% of years over that time; that means it gained 73% of the time.
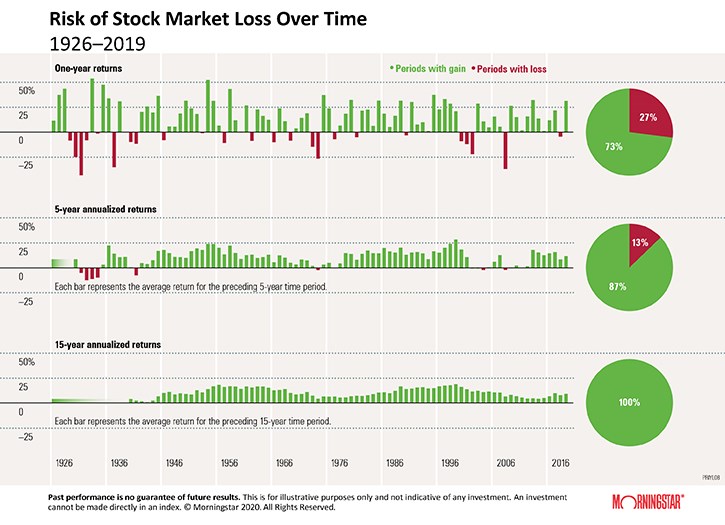
If we look at longer term figures, it gets even better. Analysing each five-year period during that time frame we can see that the market delivered positive annualised returns over five years 87% of the time. And, analysis of longer time periods shows that the market delivered positive 15-year annualised returns 100% of the time between 1926 and 2019. It highlights why taking a long-term view and not trying to predict the market tends to pay out as a strategy in the end.
Getting Out Means Missing Out
A common investment adage is: “It’s time in the market not timing the market”. What that means is it’s better to put your money in the stock market and leave it there rather than trading when there’s volatility and attempting to estimate when might be the best time to buy or sell. Because just missing out on a handful of the best days on the market can seriously hit your returns over the long-term.
As the below chart shows, staying out of the market can significantly limit your returns. The light green bars show the return achieved in each calendar year if an investor had missed out on the single best performing month that year. The dark green indicates the return an investor would have achieved by staying in the market the entire time.
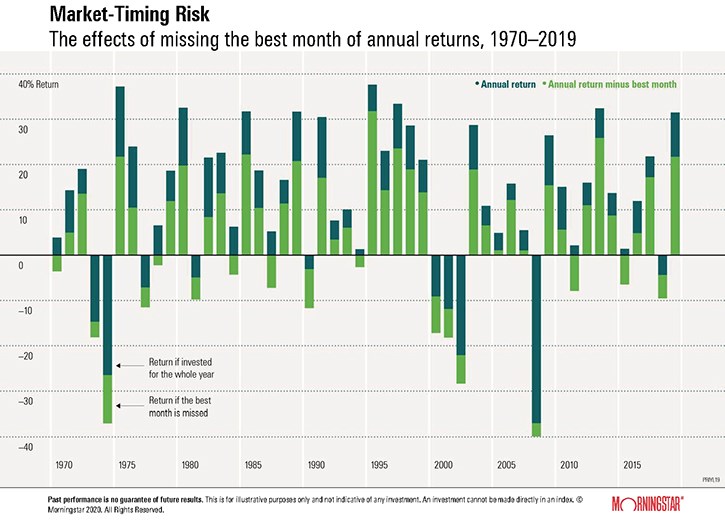
Even in bad years, we can see that trying to guess when the stock market will and won't perform rarely works out. In 1974, for example, trying to time the market could have led to overall losses around 10 percentage points greater than staying put.
In a growth market, staying invested works as a strategy year in year out and we can see that in more mediocre years, trying and failing to time the market can be the difference between positive and negative returns for the year as a whole.