Investors were wild for risk assets in 2021, but 2022 has not been a complete reversal despite market conditions. While outflows prevail across asset classes, the rate of outflows has been moderate relative to previous periods of volatility. There have been no signs of "capitulation" in any asset class. While key asset classes endured negative returns so far in 2022, investors have withdrawn only a net $136 billion, which translates to an organic growth rate of -0.29%.
By contrast, over the same period last year, investors poured $1,441 billion into long-term funds, for a half-year growth rate of 3.5%. Investment flow rates have been modestly negative because "There Is No Alternative (to stocks)," aka TINA, still dominates: interest rates remain relatively low, inflation is high, and there is no obvious alternative risk asset providing escape.
A more compelling explanation for the absence of investor panic is that portfolios are implemented through programmes now more than ever. Programmes include schemes like the US' 401(k) system; model portfolios; and plain old allocation funds, which remain popular in Europe and Canada. Investments in these programmes are made regularly and automatically, and the strategies themselves rebalance to adhere to their stated investment policies.
Tactical tweaks by investors are discouraged; most investors follow the advice and refrain from fiddling. In the case of model portfolios and target-date funds, rebalancing is performed automatically on a periodic basis because every strategy must adhere to its stated investment policy. Because equity returns have been more negative this year than fixed-income returns, automatic rebalancing triggers incrementally more allocation to equity strategies than fixed income, all else being equal.
Asset Classes Compared
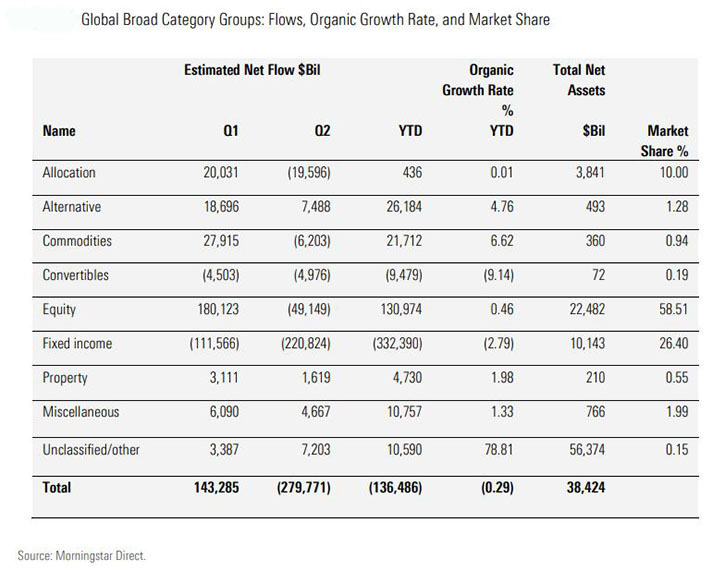
Equity funds eked out a positive net flow for the first half of the year. As rebalancing has become institutionalised, especially in the US, investors' agents (fund portfolio managers, platforms, and advisers) must buy equities to stay within investment policy guidelines. While the magnitude of fixed-income outflows was notable, as a percentage of assets (an organic growth rate/OGR of negative 2.96%) it was lower than other similarly volatile quarters. The rate at the beginning of the coronavirus pandemic in the first quarter of 2020 was negative 3.11%, while the worst in our data set, which begins in 2007, was the fourth quarter of 2008, when the rate was negative 5.12%. Assets fell to $38 trillion from $48 trillion at the end of 2021 primarily owing to the market depreciation of both equities and bonds.
Geographic Fund Flows
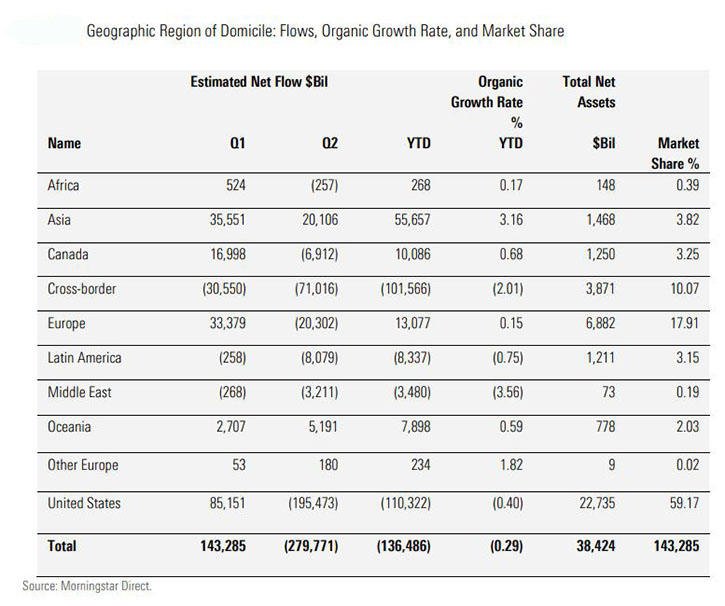
US-domiciled funds and ETFs held 59% of retail assets globally as of the end of June. The liquidity, transparency, and availability of US ETFs likely explains its increasing dominance. Note that figures for Oceania – which include Australia and New Zealand – are under-reported because of prevailing fund company reporting policies.
Largest Fund Groups
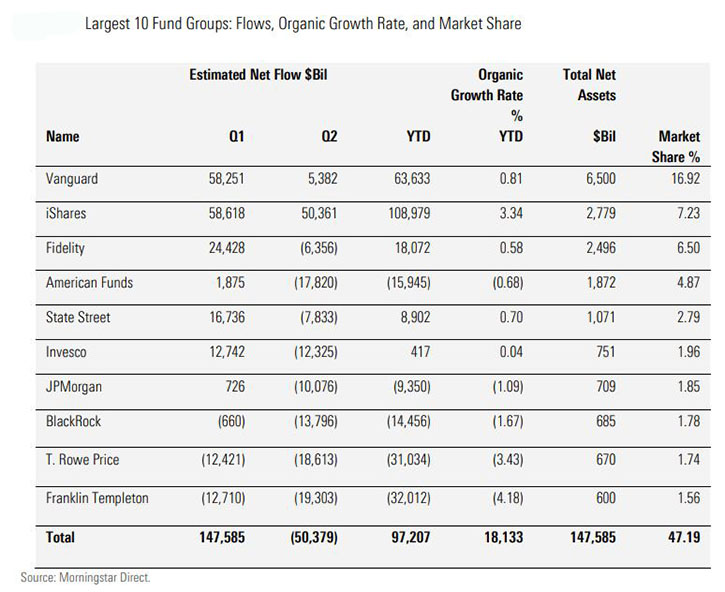
BlackRock-owned iShares blew away the competition in the first two quarters of the year, gathering the most net inflows in each quarter, for a total of $109 billion. The firm thrived in both equity and fixed income, collecting $69 billion and $34 billion, respectively. Success came from across the firm's product lineup; 515 different strategies enjoyed positive flows. IShares was one of only two of the largest 10 fund groups globally to enjoy inflows in the second quarter. Vanguard was the other.
Only 13 of the largest 50 managers had positive inflows. Franklin Templeton suffered the most on an organic growth basis, shrinking by 4.18%. The group was a victim of its strength in fixed income, which as group endured a disproportionate number of outflows in the first half of the year. The top 10 fund groups by assets held 47% of global assets under management. The remaining 3,000+ firms share the remainder.
Staying the Course
Investors' response to 2022's market volatility has been one global, collective shrug. Most investors say they are in it for the long haul; their actions in 2022, or lack thereof, demonstrate their commitment. Investors don't control interest rates, inflation, the economy, geopolitics, or public health, but they can control their investing decisions in any environment. Thus far, they have held the line.
Methodology
We focus on rates (specifically, organic growth rate) rather than absolute dollar amounts in this report in order to place flow dollar amounts in the context of total assets. The rapid appreciation of risk assets over the past decade has made the comparison of asset flows over time fraught with opportunity for misinterpretation and hyperbole. For example, assets in global funds and ETFs rose to $48 trillion at the end of 2021 from $17 trillion at the end of 2011. A hypothetical $100 billion outflow in 2011 would have been the same magnitude as a $280 billion outflow in 2021.


:quality(80)/cloudfront-us-east-1.images.arcpublishing.com/morningstar/MNPB4CP64NCNLA3MTELE3ISLRY.jpg)