
The notion that a portfolio shared between stocks and bonds lowers the degree of risk collides with the empirical evidence of the markets. This holds even more true after the collapse due to the coronavirus.
A financial portfolio shouldn’t be judged only by performance, but it also should be judged by the balance between risk and return in the long term. A relationship that, by its nature, is precarious and changeable and therefore must be periodically sought through the investment-rebalancing activity.
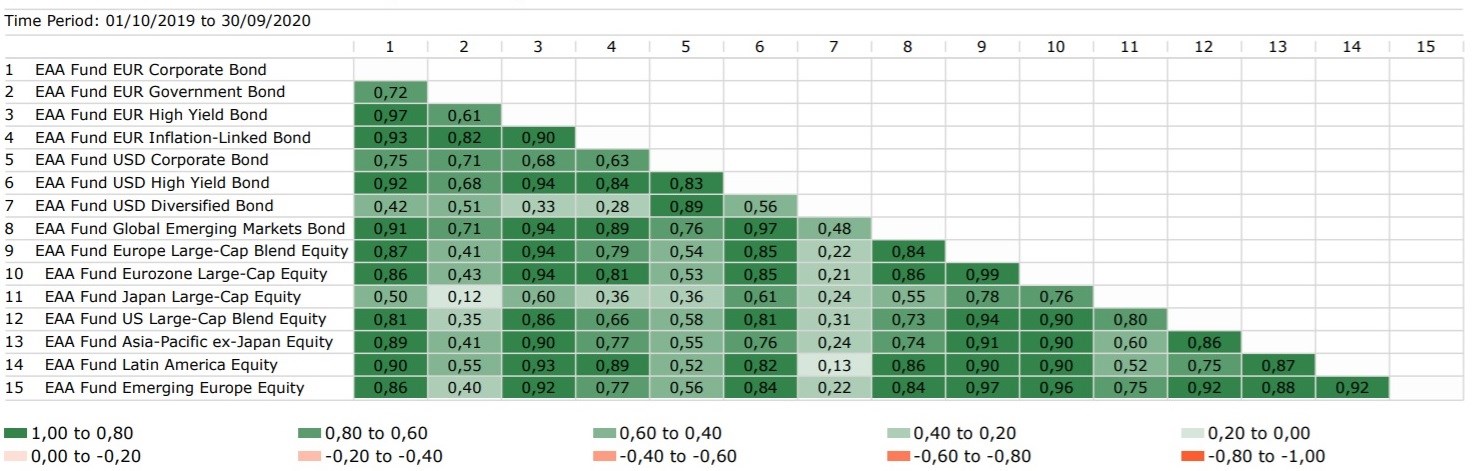
Looking at the tables below, you can easily see that Morningstar categories - equity and bond funds - have generally increased their correlation over the last year. There are no longer negative correlations, nor any close to zero (the lowest, 0.12, is the one between euro government-bond funds and Japan large-cap equities).
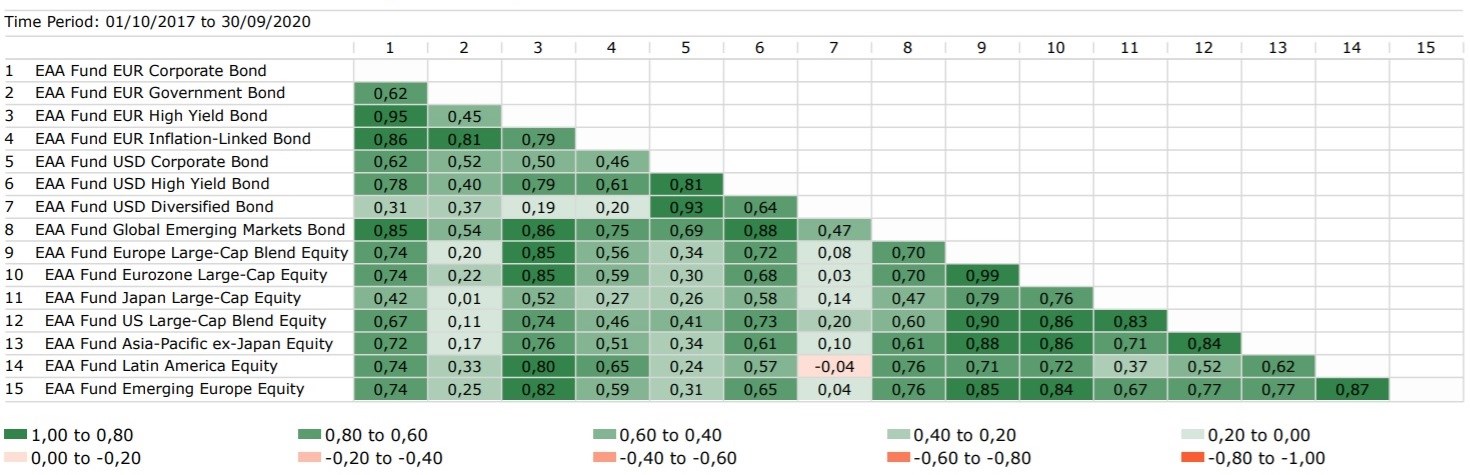
USD diversified bond funds - also partially euro government-bond funds - are the only ones that have guaranteed low correlations with equity categories in the last 12 months, although these are decidedly higher compared with those registered over three and five years.
It should be noted that these two categories have also seen their correlation rate with other groups of fixed-income funds increase significantly. The rate between euro government bonds and USD high-yield bonds, for example, went from 0.30 over five years to 0.68 over last year.
Calculating your portfolio’s correlation coefficient is a rather complex exercise. To get a general idea, we calculated the correlation coefficients of the 15 main Morningstar categories, over one, three, and five years, to the end of September 30.
Green and Red
To interpret the tables below you can use the colors: the more the box tends to green, the higher the correlation is; on the other hand, the more the box tends to red, the more negative the coefficient is.
One-year correlation coefficients (monthly data)
Three-year correlation coefficients (monthly data)
Five-year correlation coefficients (monthly data)
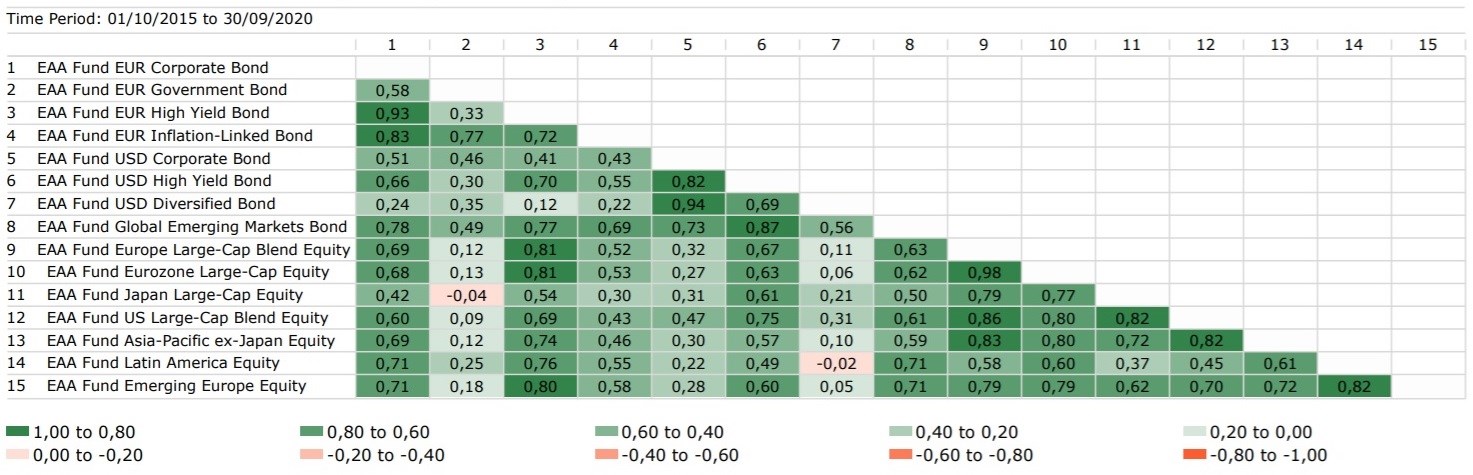
Data in euros as of Sept. 30, 2020.
Source: Morningstar Direct.
The correlation coefficient measures how the performance of one instrument affects the performance of another: it varies between negative 1 and positive 1. A coefficient of 0 indicates that there is no correlation between the two funds. A coefficient of 1 indicates that there is a perfect positive correlation, which means that the two instruments move together: if one rises by 10%, the other does too, and vice versa. Obviously, in the case of perfect negative correlation (equal to negative 1) the ratio is inverse: if the first rises by 10%, the second loses 10%.