Commodities funds turned in the strongest performance in August, our monthly heatmap shows, in what turned out to be a mixed month for investors.
As the gold price reached heady new highs, commodities funds saw an average return of 3.3% in the month, according to Morningstar Direct data. It comes after lacklustre performance from the asset class the previous month. And surprisingly, it wasn't just gold shining in August, a breakdown of the various commodity subcategories showed that all areas of the group produced positive returns. Even energy, which has been hit hard by a slump in oil demand in recent months, saw an average return of 3.1%.
But not all categories were in positive territory. Our monthly heatmap shows the average performance of all asset classes, and it's a festive mix of red and green for August.
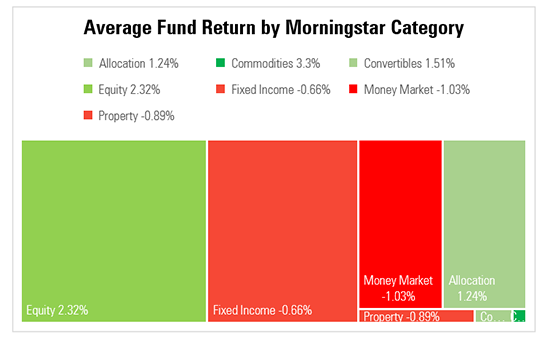
In a lighter shade of green, equity funds were up on average 2.32%. Here, however, the difference in performancec across the regions was pronoucned: while it was another good month for US large-cap growth funds, which returned on average 6.3%, Latin America funds fell by 6.23%. Brazil was the hardest hit, down 8.73% as it continues its battle against the spread of Covid-19.
UK funds, meanwhile, finally found themselves in positive territory, buoyed by the Government's "Eat Out to Help Out" scheme, which has injected a hint of normality in many people's lives as well as some much-needed spending into the restaurant sector. On average, mid-cap and small-cap ones were up more than 5% during the month, and large-caps 2.2%.
Worst Performing Asset Classes
At the other end of the spectrum, the darkest shade of red depicts the weakest asset classes - money market, property and fixed income funds fell by 1.03%, 0.89% and 0.66% respectively in the month. Inflation-linked bond funds in particular had a difficult month, falling by 4.52% and dominating our list of worst performing funds in August.
The chart below shows the returns of each asset class in August. The size of the box denotes the level of assets under management in the category.
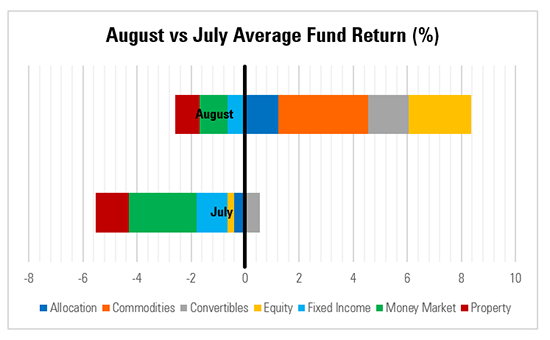
Performance is Improving
When comparing the last two months (line graph below), it's clear that performance in August saw a positive turnaround from July . Indeed, all but one asset class were on the "wrong" side of the black line in July, indicating negative returns, while in August there is a wider spread.
In a turbulent year it appears that investors cannot yet rest on their laurels; the monthly fluctuations in performance are determined by a mix of investor sentiment, economic data and the latest outlook for the Covid-19 pandemic.