


"We seem to have a once-in-a-lifetime crisis every three or four years." --Leslie Rahl, founder of Capital Market Risk Advisors1
The dramatic events on Wall Street and in financial centers around the world that started on "Black Sunday," Sept. 14, have upset many common assumptions ab
out the global financial system. What started as a mortgage crisis spread to nearly every corner of the financial system when Lehman Brothers collapsed, Merrill Lynch sold itself to Bank of America, and AIG became strapped for cash--all in a single weekend. These and the events that followed have shaken investor confidence to the core. As of Dec. 31, the Dow Jones Industrial Average was down 22.4% since Black Sunday. The yield spread on junk bonds over LIBOR reached an unprecedented 16%. The markets for many assets have become illiquid, and credit is dried up for nearly anyone who needs it. The U.S. Federal Reserve, the U.S. Treasury, and their counterparts around the world have taken dramatic steps to restore liquidity to asset markets, stimulate lenders to make loans again, shore up investor confidence in equity markets, and avoid a deep global recession.
If you need to be reminded how bad things are, listen to our political and fiscal-policy leaders as they describe the crisis with phrases that begin with the ominous words "once in a . ." As they were pushing their $700-billion bailout package last fall, members of the Bush administration said that the crisis was a "once-in-a-century event," and this was echoed in November by Henry Paulson, the former secretary of the U.S. Treasury, who said the meltdown was a "once- or twice-in-a-100-year event." Former Federal Reserve chairman Alan Greenspan characterized the crisis as a "once-in-a-century credit tsunami."
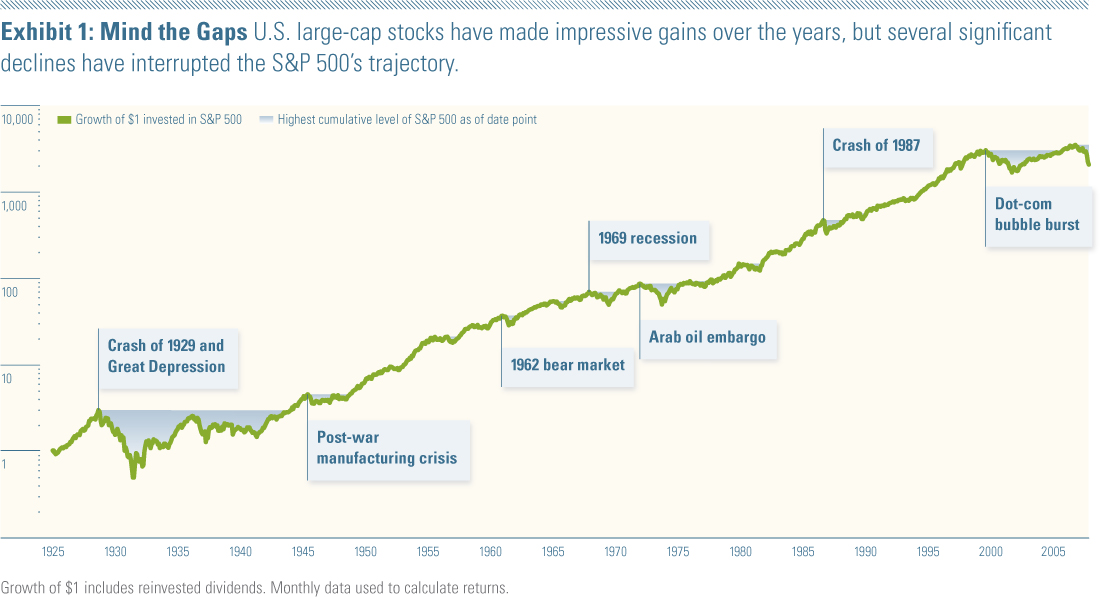
There's little doubt that aspects of this crisis are unique and that the economy is facing its hardest challenge since the Great Depression, but are severe economic crises the rare events Paulson, Greenspan, et al., have suggested? A study of capital market history suggests no. To see this, you need to look no further than the Ibbotson Stocks, Bonds, Bills, and Inflation poster from Morningstar hanging on your wall. Take, for example, the poster's depiction of the compound annual return of the S&P 500 Index, identified on the chart as Large Stocks.2, 3 The growth of $1 to $2,049 over 83 years is impressive (a rate of 9.6% per year), but the record is peppered with several long and severe declines, some in the not-too-distant past.
To illustrate our point, we isolated the S&P 500 line of the poster and added blue areas that show the highest level that the cumulative value of the S&P 500 had achieved as of that date (Exhibit 1). Wherever a blue area is shown, the S&P 500 was amid a decline relative to its most recent peak. The deeper the gap, the more severe the decline; the wider the gap, the longer the time until the S&P 500 returned to its peak. Wherever a blue area is not shown, the S&P 500 was climbing to a new peak.
Not surprisingly, the granddaddy of all market declines started with the Crash of 1929 and did not recover until 1945. The S&P 500 lost more than 83% of its value in about three years and took 12 1/2 years to recover. What may be more sobering, however, is that the second-greatest decline took place within the past decade. With the crash of the Internet bubble in 2000, the S&P 500 lost almost 45% of its value over a two-year period and took four years to return to its peak value.
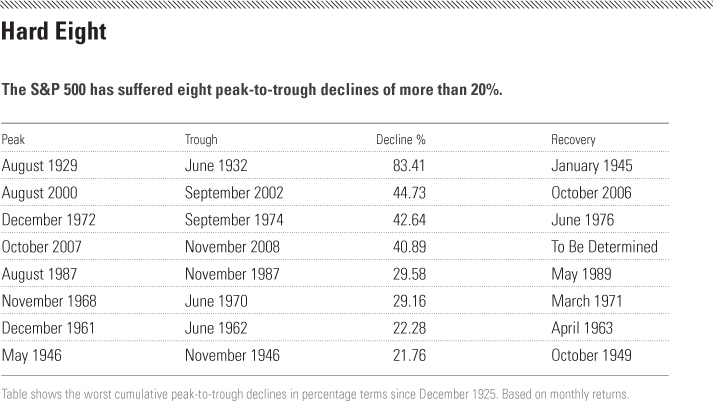
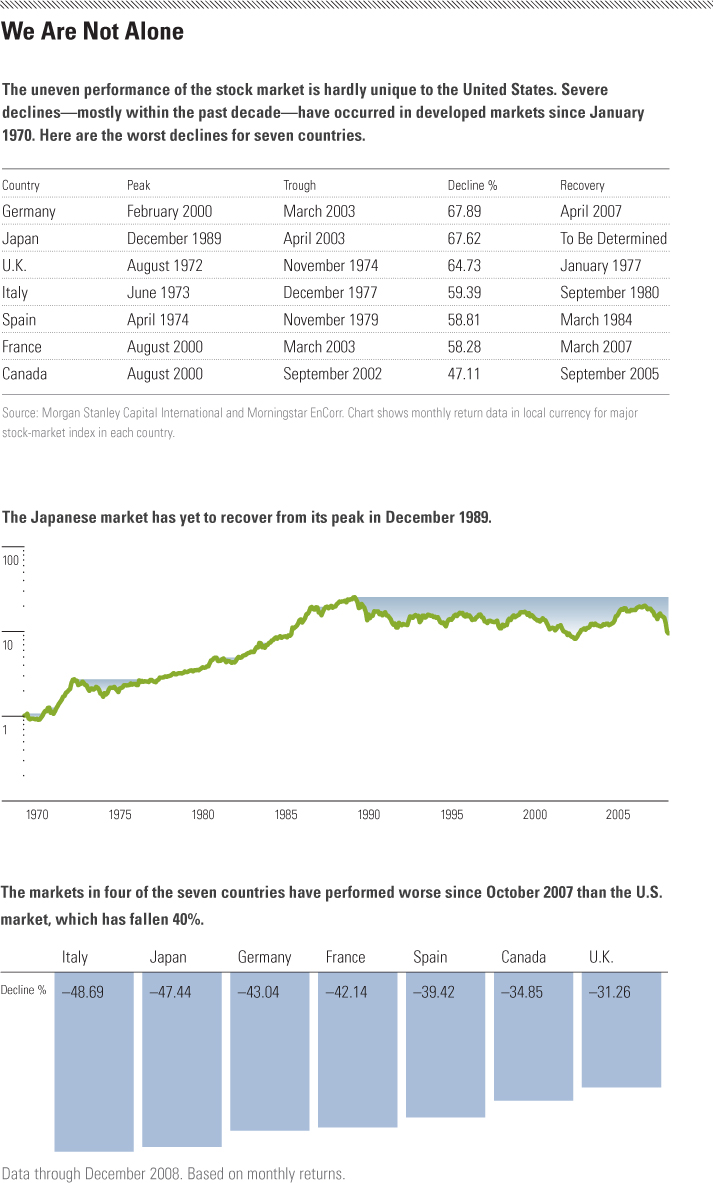
In all, including the current crisis, the S&P 500 has suffered eight peak-to-trough declines of more than 20% since the mid-1920s. Two of the three greatest declines occurred in the past eight years. Similar events can be seen in other major markets around the world. To suggest that the current crisis is a once-in-a-century event ignores the record.
Footnotes:
1. As quoted by Christopher Wright, "Tail Tales," CFA Institute Magazine, March/April 2007.
2. We obtained the historical monthly total returns from Morningstar EnCorr, an institutional asset-allocation software and data package.
3. We use a logarithmic scale for all growth of $1 charts.
This article first appeared in the February/March 2009 issue of Morningstar Advisor Magazine.


